

TL;DR
TACOS = Total Ad Spend ÷ Total Revenue × 100. It measures advertising cost as a share of all sales — paid and organic combined. Good benchmarks by stage: launch phase (15–25% acceptable), growth phase (10–15% good), mature brand (5–10% excellent), dominant organic (<5% world-class). TACOS differs from ACOS in that it includes organic sales in the denominator, making it a whole-business profitability signal rather than a campaign efficiency metric. A declining TACOS trend is the primary indicator of a healthy brand building sustainable organic traction. Track it weekly — not monthly — so you catch organic erosion before it turns into a revenue problem.
Most ecommerce operators know their ACOS. Far fewer track their TACOS — and that gap is expensive. ACOS tells you whether a campaign is efficient. TACOS tells you whether your brand is building something durable.
A brand spending $30,000 per month on Amazon ads can have an excellent ACOS of 18% while its TACOS creeps up to 28%. That divergence is a warning: ad-attributed sales are strong, but organic sales are declining. Without the TACOS view, you miss it entirely until revenue starts falling without any obvious cause.
This guide covers the TACOS definition, the exact formula, worked examples, benchmarks by product lifecycle stage and category, how TACOS compares to ACOS and MER, and the specific levers operators use to bring TACOS down without sacrificing growth.
What Is TACOS? The Definition
TACOS stands for Total Advertising Cost of Sale. It expresses your total advertising spend as a percentage of your total revenue — including both sales generated by ads and sales generated organically.
The key word is total. Most ad efficiency metrics — ACOS, ROAS, CPA — only count revenue that the ad platform claims credit for. TACOS counts everything: ad-driven sales, organic search sales, direct traffic, repeat purchases from existing customers, and any other revenue channel in your business.
That broader view makes TACOS a fundamentally different kind of signal. It does not tell you whether a campaign was efficient. It tells you whether your advertising investment is contributing to a business that is becoming more profitable over time — or one that is growing more dependent on paid spend to sustain its revenue.
A TACOS of 12% means you spent $12 in advertising for every $100 of total revenue your business generated. A TACOS of 25% means you spent $25 for every $100. The gap between those two numbers is the difference between a business building organic equity and one running a paid-traffic treadmill.
TACOS Formula: How to Calculate It
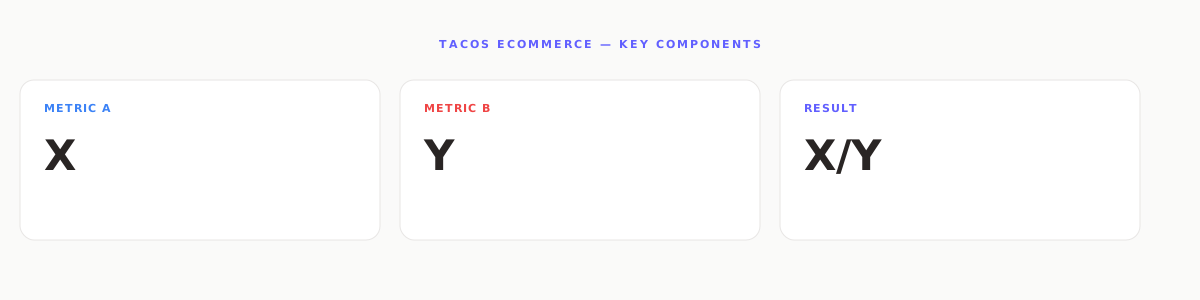
The formula is straightforward. The common errors are in the inputs.
Total Ad Spend means every dollar you spent on advertising — Amazon Sponsored Products, Sponsored Brands, Sponsored Display, Google Shopping, Meta, TikTok, and any other paid channel. Do not include only one platform. If you run ads on multiple platforms, all of it goes into the numerator.
Total Revenue means every dollar of sales your business generated in the same period — ad-attributed and organic combined. On Amazon, that means your total order revenue, not just orders the attribution report assigns to campaigns. For DTC brands, it means all Shopify or platform revenue, regardless of the acquisition source.
Worked Example: Amazon Brand — Monthly TACOS
The same $18,500 in ad spend produces an ACOS of 25.7% and a TACOS of 14.5%. Both numbers are accurate. They answer different questions. ACOS measures how efficiently each campaign converted paid clicks to paid orders. TACOS measures how much ad spend was required to support the entire business in that period.
If this brand's organic revenue next month drops to $30,000 while ad spend and ad-attributed revenue hold flat, ACOS stays at 25.7%. But TACOS climbs to 18.1%. That divergence is the early signal that organic traction is eroding — before it shows up in any campaign-level metric.
What Is a Good TACOS for Ecommerce?
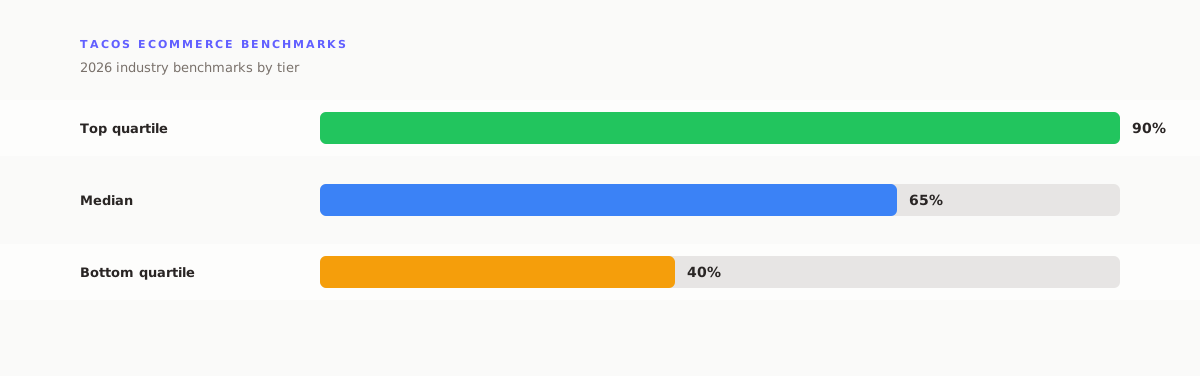
There is no universal threshold that applies to every brand and every category. TACOS is context-dependent. A 20% TACOS is a strong signal of health for a brand in its third month of launching a new product line. The same 20% TACOS is a serious warning for a brand with two years of sales history and established organic rankings.
The most useful framework evaluates TACOS against two variables: your product lifecycle stage and your gross margin. Both shape what "good" actually means for your specific business.
TACOS Benchmarks by Product Lifecycle Stage
| Stage | Typical TACOS | Assessment | What It Signals |
|---|---|---|---|
| New Launch (0–6 months) | 15–30% | Acceptable | Building velocity and organic rank |
| Growth Phase (6–18 months) | 10–18% | Good | Organic growing faster than ad spend |
| Mature Brand (18+ months) | 5–12% | Excellent | Strong organic base, ads for defense |
| Dominant Organic Presence | <5% | World Class | Organic drives the business |
| Any Stage — Rising Trend | Any rising | Warning | Organic share declining |
The lifecycle framework matters because TACOS is designed to compress over time. A brand that launches at 25% TACOS and is still at 25% TACOS eighteen months later has not built organic equity — it is running on a paid treadmill. The goal is not to hit a target number. The goal is to watch the number trend down as your organic footprint grows.
TACOS Benchmarks by Amazon Category
Category competitiveness shapes what TACOS is achievable at maturity. Highly competitive categories require more defensive ad spend to protect organic rankings. Less competitive niches with strong search volume allow brands to maintain position with minimal spend.
| Amazon Category | Competitive Level | Mature TACOS Target | Launch TACOS |
|---|---|---|---|
| Supplements / Vitamins | Very High | 12–20% | 25–35% |
| Consumer Electronics | Very High | 10–18% | 20–30% |
| Beauty & Personal Care | High | 10–16% | 18–28% |
| Home & Kitchen | Medium | 8–14% | 15–25% |
| Sports & Outdoors | Medium | 7–13% | 14–22% |
| Pet Supplies | Medium | 6–12% | 12–20% |
| Specialty Food & Grocery | Lower | 5–10% | 10–18% |
| Niche / Non-commoditized | Low | 4–8% | 8–15% |
These benchmarks reflect mature, established products in each category. New launches should expect TACOS 8–12 percentage points higher than the mature target during the first six months as they build organic velocity.
The Gross Margin Rule for TACOS
The most actionable TACOS threshold is derived from your own margin structure, not from an industry table. The rule is simple: if your TACOS exceeds your gross margin percentage after platform fees, you are losing money on a contribution basis.
If your gross margin after Amazon fees is 43% and your TACOS is 35%, your contribution margin — the money left after COGS, fees, and advertising — is only 8%. That leaves nothing for fulfillment, returns, or overhead. You are converting inventory into near-zero-margin revenue with extra steps.
TACOS Margin Health Check
With a 43% margin after fees and a 14% TACOS, this brand retains 29% contribution margin — which is healthy. If TACOS climbed to 30%, contribution margin would fall to 13%. At 43% TACOS, the business breaks even on advertising. The gross margin ceiling defines the maximum viable TACOS for your specific economics.
TACOS vs ACOS: The Critical Difference
ACOS and TACOS are both ratios of ad spend to revenue. The denominator is what separates them — and that difference changes what each metric is actually telling you.
The second row above is the most dangerous scenario: ACOS and TACOS converge. When ACOS equals TACOS, your organic revenue has effectively gone to zero — every sale in your business is ad-attributed. That means your revenue disappears the day you pause campaigns. Most operators only notice this when they pause campaigns and watch sales collapse.
Red flag to watch: If your ACOS and TACOS are converging month over month — getting closer to each other rather than farther apart — organic sales are declining as a share of total revenue. This is one of the earliest indicators of platform dependency before it becomes a revenue crisis.
TACOS vs MER: Which Metric to Use When
MER (Media Efficiency Ratio) is TACOS expressed as a multiple rather than a percentage. Where TACOS divides ad spend by total revenue, MER divides total revenue by ad spend.
The two metrics are mathematically identical — one is the inverse of the other. The choice between them is mostly a matter of which frame resonates with your team and how you report to stakeholders.
DTC brands running Meta and Google tend to use MER because agency reporting tools express blended efficiency as a multiple. Amazon sellers tend to use TACOS because Seller Central and third-party Amazon analytics tools present ad metrics as percentages aligned with the ACOS framework.
For operators managing both Amazon and DTC channels, tracking TACOS at the channel level and MER as the blended company-wide view provides complementary signals without conflating different business dynamics. The blended vs true ROAS distinction follows the same logic — the denominator determines what question you are actually answering.
TACOS for DTC and Shopify Brands
TACOS originated as an Amazon metric, but the logic applies directly to any DTC brand running paid advertising alongside organic channels. The math is the same. The benchmarks shift based on channel economics.
A Shopify brand running Meta and Google ads calculates TACOS as total paid media spend divided by total store revenue. Good targets for a DTC brand at each stage:
| DTC Stage | Revenue Range | Target TACOS | Primary Driver |
|---|---|---|---|
| Early DTC | <$500K ARR | 20–35% | Paid acquisition, brand building |
| Growing DTC | $500K–$5M ARR | 15–25% | Retention improving, email growing |
| Scaling DTC | $5M–$20M ARR | 10–18% | Repeat revenue covers more base |
| Established DTC | $20M+ ARR | 8–14% | Strong retention + organic channels |
DTC brands have one advantage over Amazon sellers: more control over organic channels. Email, SMS, SEO, influencer content, and community all generate revenue that does not appear in any ad platform's attribution window. Every dollar of revenue from those channels expands the TACOS denominator without increasing ad spend — making TACOS one of the clearest long-term indicators of whether a DTC brand is building a durable business or renting its revenue from Meta.
Operators tracking contribution margin alongside TACOS get a more complete picture. TACOS tells you what percentage of revenue ad spend consumes. Contribution margin tells you what is actually left after COGS, ads, and variable costs. The two metrics together describe the full profitability picture at the product and channel level.
Why TACOS Matters More Than ACOS or ROAS Alone
ACOS and ROAS are campaign-level metrics. They answer whether a specific ad campaign or ad group is generating revenue efficiently relative to what you spent on it. Both are useful for optimizing individual campaigns. Neither tells you whether your brand is becoming more or less dependent on advertising over time.
TACOS is a business-level metric. It captures the fundamental economic question that determines whether an ecommerce brand has long-term viability: is advertising building organic equity, or is it the whole foundation of the revenue?
TACOS also surfaces a risk that ACOS and ROAS systematically hide: the false attribution problem. Ad platforms claim credit for every sale that occurs within a click-attribution window — including organic purchases, branded searches, and repeat buyers who were going to purchase regardless. ACOS can look excellent while TACOS is elevated, because the platform is taking credit for organic demand.
Tracking TACOS forces you to look at actual sales relative to actual spend. It cuts through platform attribution noise to ask the only question that matters at the business level: of every dollar your business generated this month, how many cents went to pay for advertising?
This is also why TACOS pairs naturally with cohort analysis for ecommerce. Cohort data tells you whether customers acquired through paid channels return and purchase again organically. TACOS tells you the aggregate result of that compounding across your whole business.
7 Proven Ways to Improve Your TACOS
Improving TACOS means growing total revenue faster than ad spend, reducing ad spend without losing organic rank, or both. The levers below target each side of the equation.
TACOS Traps: When a Low Number Is Misleading
A low TACOS is not always a positive signal. There are three scenarios where a declining TACOS is actually a warning:
Underinvestment in growth: A TACOS below 5% can mean you have a dominant organic presence — or it can mean you are starving the business of the advertising investment needed to defend rank and acquire new customers. If revenue is flat or declining alongside a falling TACOS, the metric is not improving — the business is shrinking.
Organic rank deterioration masked by reduced spend: If you cut ad spend without maintaining organic rank, total revenue falls faster than ad spend. TACOS can improve temporarily before the full revenue impact arrives. Monitor revenue trajectory alongside TACOS, not TACOS alone.
Seasonal distortion: Categories with strong seasonal organic demand will show artificially low TACOS during peak organic seasons and artificially high TACOS in off-peak periods. Compare TACOS year-over-year for the same period, not just the trailing month.
The right question: Is TACOS declining because organic revenue is growing faster than ad spend — or because you are spending less on ads while revenue holds flat or falls? The mechanism matters as much as the number. Track organic revenue as a standalone metric alongside TACOS to know which scenario you are in.
How to Track TACOS Across Amazon and DTC Channels
The core challenge with TACOS at scale is data aggregation. Amazon Seller Central does not display TACOS natively — you have to pull advertising data and total order data from separate reports and combine them manually. DTC operators face the same problem across Meta, Google, Klaviyo, and Shopify.
For operators managing both Amazon and a DTC storefront, getting to a blended TACOS requires pulling ad spend from every platform, revenue from every channel, and combining them in a calculation that neither platform will do for you automatically.
Most operators handle this one of three ways:
- Manual spreadsheet: Pull data from each platform weekly, enter it in a tracking spreadsheet, calculate TACOS manually. Takes 2–4 hours per week. Error-prone. Always at least a week stale.
- Third-party Amazon analytics tools: Tools like Helium 10, Jungle Scout, and DataDive provide TACOS calculations for Amazon-only sellers. They do not typically combine Amazon with DTC channels.
- Operating intelligence platform: Connect all revenue and ad spend data sources to a unified platform that calculates TACOS automatically across channels, updates continuously, and alerts you when the trend line moves.
Fairview's operating intelligence platform for DTC brands calculates TACOS across Amazon, Meta, Google, and Shopify simultaneously — so operators see the blended number and channel-level breakdowns without manual assembly. When TACOS on one channel diverges from the others, the platform surfaces that signal directly rather than burying it in a dashboard operators have to manually construct.
The practical difference is response time. A brand tracking TACOS manually in a spreadsheet typically notices organic erosion 4–6 weeks after it begins — by which time organic rank may have declined enough that recovering it requires months of elevated ad spend. A brand tracking TACOS continuously catches the early signal and can respond before the compound effect takes hold.
For operators managing D2C unit economics, TACOS fits into a broader framework alongside contribution margin, customer LTV, and blended ROAS. Each metric answers a different question about the same underlying economics. TACOS answers whether the advertising budget is building or eroding the organic business. Contribution margin answers whether the unit economics support profitability at the current revenue mix. Understanding marketing mix modeling for DTC helps operators model what mix of paid and organic investment produces the best TACOS trajectory over a 6–12 month horizon.
Key Takeaways
- TACOS = Total Ad Spend ÷ Total Revenue × 100. Lower is better. It measures ad cost as a share of your entire business — not just ad-attributed sales.
- Good benchmarks by stage: Launch (15–25% acceptable), Growth (10–15% good), Mature (5–10% excellent), Dominant organic (<5% world-class).
- TACOS differs from ACOS because it includes organic revenue in the denominator. When ACOS and TACOS converge, organic sales are disappearing from your business.
- The trend matters more than the number. A consistently declining TACOS over 6–12 months is the primary indicator that your brand is building organic equity.
- Compare TACOS to your gross margin after fees. If TACOS exceeds your net margin after COGS and platform fees, you are losing money on a contribution basis.
- For DTC brands, email and SMS are the fastest path to TACOS compression — repeat revenue expands the denominator without increasing ad spend.
- Track it weekly, not monthly. Organic rank erosion compounds fast. Early detection through weekly TACOS tracking lets you respond before the damage compounds.
- A low TACOS is not always good. If revenue is declining alongside a falling TACOS, the business is shrinking — not becoming more efficient.