

TL;DR
The LTV:CAC ratio measures how much value a customer generates relative to what it cost to acquire them. The SaaS gold standard is 3:1. To improve it, you can increase LTV (reduce churn, drive expansion) or reduce CAC (tighten ICP, improve conversion rates, shift channel mix). Most companies chase CAC reductions but ignore the larger LTV opportunity on their existing customer base.
You close a deal. You spend $8,000 in sales and marketing to get there. That customer pays $400 per month and stays for 18 months. Total revenue: $7,200. You lost money acquiring that customer.
That is the LTV:CAC problem in concrete terms. And for a large share of SaaS companies growing fast on vanity metrics, it is the invisible trap eroding unit economics quarter by quarter.
The LTV:CAC ratio is the single number that tells you whether your growth is actually worth funding. A ratio of 3:1 is the industry benchmark. A ratio of 4:1 or higher is best-in-class. Below 2:1, you are subsidizing customers who will never pay for themselves.
This guide walks through how to calculate the ratio correctly, where most teams get it wrong, and six levers you can pull to move from average to exceptional.
What LTV:CAC Actually Measures
The LTV:CAC ratio answers one question: for every dollar you spend acquiring a customer, how many dollars of lifetime value do you get back?
LTV (Customer Lifetime Value) is the total gross profit you expect to generate from a customer over their relationship with you.
CAC (Customer Acquisition Cost) is the total sales and marketing spend required to win that customer.
The standard formula:
LTV Formula
LTV = (ARPU × Gross Margin %) ÷ Churn Rate
Where ARPU = Average Revenue Per User (monthly) and Churn Rate = monthly logo churn
Example: $500 ARPU × 75% GM ÷ 5% monthly churn = $7,500 LTV
CAC Formula
CAC = Total S&M Spend ÷ New Customers Acquired
Include: sales salaries + commissions + marketing spend + tools + events + agency fees
Time period: match the spend period to the acquisition period (same quarter)
The Ratio
LTV:CAC = LTV ÷ CAC
$7,500 LTV ÷ $2,500 CAC = 3:1 ratio (benchmark)
LTV:CAC Benchmarks: What Is a Good Ratio?
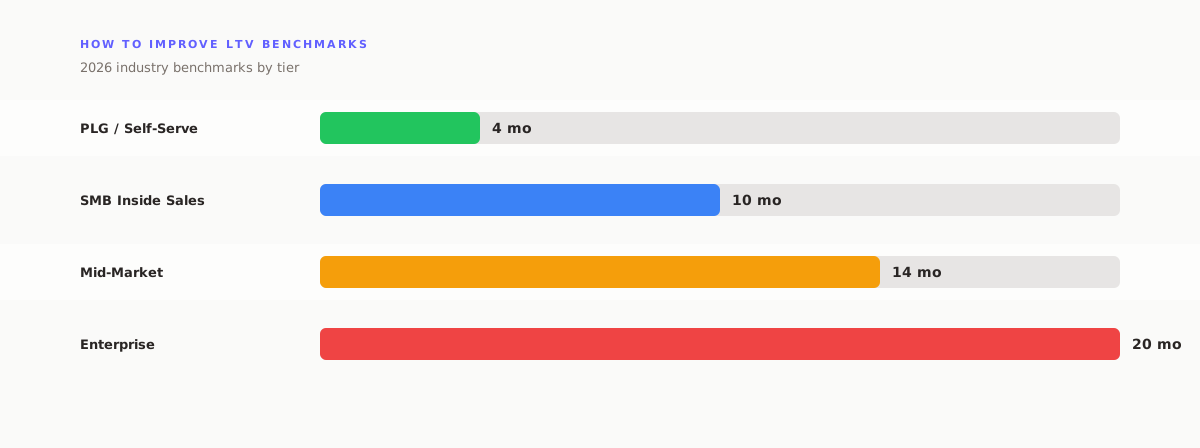
The most cited benchmark is 3:1, derived from research by David Skok and popularized through SaaS Capital and Bessemer's State of the Cloud reports. Here is the full spectrum:
| LTV:CAC Ratio | Signal | What It Means |
|---|---|---|
| Below 1:1 | Losing Money | Every customer costs more than they return. Stop scaling immediately. |
| 1:1 – 2:1 | Danger Zone | Marginal returns. No room for overhead or reinvestment. Fix before scaling. |
| 2:1 – 3:1 | Acceptable | Working but not optimal. Cautious growth is reasonable. |
| 3:1 | Benchmark ✓ | Healthy unit economics. Standard for Series B+ fundraising conversations. |
| 4:1 – 5:1+ | Best in Class | Exceptional efficiency. Push harder on growth — the engine is working. |
One important caveat: a ratio above 5:1 can indicate you are under-investing in growth. If your unit economics are that strong, the right move is often to spend more on sales and marketing, not less.
Why Most Teams Calculate LTV:CAC Wrong
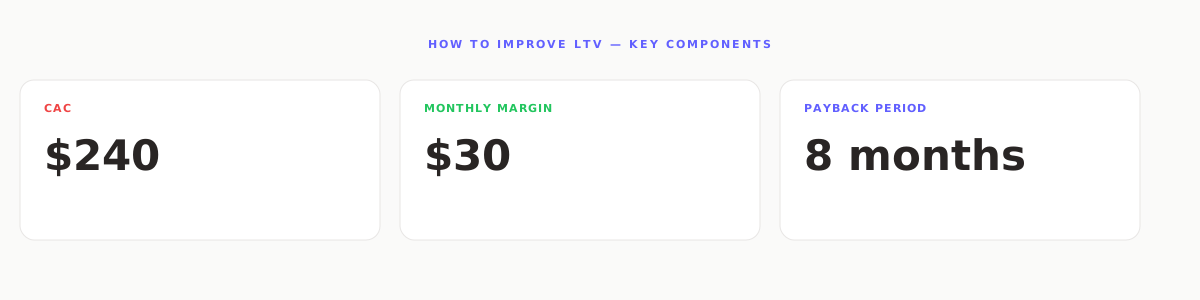
The ratio is simple in concept, but measurement errors are common and they all cut in the same direction — they make the ratio look better than it is.
Mistake 1: Using Revenue Instead of Gross Profit for LTV
LTV must be calculated on gross margin, not gross revenue. If a customer pays $12,000 per year but your gross margin is 60%, the LTV contribution is $7,200 — not $12,000. Using revenue inflates LTV by your gross margin percentage.
Mistake 2: Excluding Overhead from CAC
CAC should include full-loaded sales and marketing costs: salaries, commissions, benefits, tools, agency fees, event sponsorships, and content production. Teams that use only ad spend as their CAC denominator routinely understate acquisition cost by 3–4×.
Mistake 3: Mismatching Time Periods
Sales cycles complicate attribution. If you spend $200K in Q3 and close 15 deals in Q4 (from Q3 pipeline), you should match Q3 spend to Q4 closes — not divide Q3 spend by Q3 closes. Mismatched periods distort both CAC and the ratio.
Mistake 4: Using a Single Blended Ratio
A blended 3:1 ratio can mask severe problems in specific segments. A $50K enterprise customer at 8:1 and a $1,200 SMB customer at 1.2:1 blend to roughly 3:1. The SMB segment is destroying value at scale. Always segment by customer tier, channel, and cohort.
6 Levers to Improve Your LTV:CAC Ratio
The ratio has two components. You can improve it by increasing LTV, reducing CAC, or doing both simultaneously. Here are the six highest-impact interventions:
Lever 1: Reduce Churn (Biggest LTV Driver)
Churn is in the denominator of LTV. Because of the division, its impact is nonlinear. Cutting monthly churn from 5% to 3% does not improve LTV by 40% — it improves it by 67%.
Churn impact on LTV (ARPU = $500, GM = 75%)
Churn reduction levers: ICP tightening (stop selling to wrong-fit customers), onboarding redesign, customer success coverage for at-risk accounts, and proactive health scoring. See our guide on SaaS churn rate benchmarks for segment-specific targets.
Lever 2: Drive Expansion Revenue (NRR > 100%)
Expansion revenue — upsells, cross-sells, seat adds, tier upgrades — extends LTV without any additional acquisition cost. A customer who doubles their contract in month 12 generates twice the LTV at the same CAC, pushing the ratio from 3:1 toward 6:1.
The measure to track here is Net Dollar Retention (NDR). If your NDR is above 100%, your existing customer base grows without any new acquisition spend. The best SaaS companies run NDR of 120–130%+. Review our NDR benchmarks guide for context on what strong expansion looks like by stage.
Lever 3: Raise Average Contract Value (ACV)
Moving upmarket — even partially — has an outsized effect on the ratio. A $24K ACV enterprise customer often has 3–4× the LTV of a $4,800 ACV SMB customer, but CAC increases much less than proportionally. The sales cycle is longer, but one enterprise deal can offset five SMB deals in LTV contribution.
Tactics: package-based pricing, platform tiers, usage-based pricing that scales with customer growth, and multi-year contracts that increase LTV certainty.
Lever 4: Improve Gross Margin
Gross margin is a direct multiplier in the LTV formula. Moving from 60% to 75% gross margin increases LTV by 25% at constant revenue. This is often overlooked because it feels like a cost structure problem, not a revenue problem — but it directly affects LTV:CAC.
Improvement paths: move infrastructure costs from variable to fixed through committed usage agreements, reduce support ticket volume through self-serve and better onboarding, and renegotiate vendor contracts at scale.
Lever 5: Tighten ICP Targeting (CAC Reduction)
Most CAC inefficiency comes from selling to the wrong customers. When your ICP is too broad, you spend equal resources on high-fit and low-fit prospects — but low-fit prospects convert at lower rates, require more sales touches, and churn faster. The result is both higher CAC and lower LTV simultaneously.
Define ICP with firmographic precision: industry, company size, tech stack, growth stage, and buying trigger. Then run a cohort analysis of your best customers (lowest CAC, highest LTV, highest NPS) to identify which attributes they share. Align demand generation toward those attributes exclusively.
Lever 6: Optimize Channel Mix by LTV:CAC per Channel
Different acquisition channels produce customers with different LTV profiles. Content-driven inbound customers often have 20–40% lower CAC than outbound-sourced customers and frequently show 15–30% lower churn because they discovered you through education rather than outreach.
Run LTV:CAC analysis at the channel level, not just the company level. If SEO-sourced customers have a 5:1 ratio while paid social customers have a 1.8:1 ratio, reallocating budget across channels can improve the blended ratio without changing your product or pricing at all.
How Fairview Tracks LTV:CAC in Real Time
Most finance teams calculate LTV:CAC quarterly from a spreadsheet. The problem: the inputs (ARPU, churn, S&M spend, new logo count) are all live numbers that move daily. By the time a quarterly report lands, the ratio reflects decisions made 90 days ago — too late to course-correct.
Fairview connects to your CRM, billing system, and financial data to calculate LTV:CAC continuously. You see the ratio update as deals close, as customers churn, and as S&M spend is logged. You can also segment it by channel, ICP cohort, rep, and customer tier in real time — so you know which segments are dragging the ratio down before the quarter ends.
LTV:CAC and CAC Payback Period: The Two Metrics You Need Together
LTV:CAC tells you the ultimate efficiency of customer acquisition. CAC payback period tells you how quickly you recover that acquisition cost in cash. Both matter.
| Metric | What It Answers | Benchmark |
|---|---|---|
| LTV:CAC Ratio | Is growth fundamentally efficient? | 3:1 minimum |
| CAC Payback Period | How long until cash break-even? | <12 months for SaaS |
A company can have a great LTV:CAC ratio (4:1) but a terrible CAC payback period (24 months) if customers are small, slow-paying, or the business is pre-expansion. That combination strains cash flow even as unit economics look healthy on paper. Track both metrics together.
Common LTV:CAC Mistakes to Stop Making
- Celebrating a high ratio >5:1 without questioning it — it may mean you are under-investing in growth rather than being exceptionally efficient
- Blending segments that should be separate — enterprise and SMB ratios belong in separate analyses
- Ignoring the payback period dimension — a 4:1 ratio paid back over 36 months is a cash flow problem
- Measuring CAC only on closed-won revenue — include pipeline investment for deals lost to get true CAC
- Using nominal LTV instead of discounted LTV — for long-lived enterprise customers, time value of money matters
Strategy 7: Fix the Measurement Before You Fix the Ratio
The most underrated LTV:CAC improvement is fixing how you calculate the number in the first place. Many teams operating with a "2.1:1" ratio discover after an accurate recalculation that the real number is 1.4:1. The measurement error comes from three sources.
LTV is measured as average revenue per customer instead of average gross profit per customer. LTV is a profit metric, not a revenue metric. If your average customer generates $4,000 in revenue over their lifetime but 60% of that goes to delivery, support, and COGS, LTV is $1,600 — not $4,000. Revenue-based LTV overstates the ratio by the inverse of your gross margin.
CAC excludes fully-loaded costs. True CAC includes all sales and marketing spend: salaries, tools, events, agency fees, content production, and ad spend. Many teams calculate CAC as ad spend only, which understates the true cost of acquisition by 40–70% depending on the business model. A team with $200K in monthly marketing spend but only $80K in direct ad spend has a true CAC that is more than double what the ad-spend-only calculation shows.
LTV cohort windows are too short. A 12-month LTV for a product with an 18-month average customer life understates the metric by design. Use historical retention data to set cohort windows that reflect actual customer behavior, not a convenient accounting period. For subscription businesses, a standard approach is to calculate LTV as: Average Monthly Revenue per Customer × Gross Margin % × (1 / Monthly Churn Rate).
Correcting for these three measurement errors typically changes the reported LTV:CAC ratio by 0.5–1.5 points. In some cases, teams that thought they had a healthy ratio discover a problem. In others, teams that thought they had a problem discover they were measuring it incorrectly and the economics are sound. Either way, accurate measurement is the prerequisite for any meaningful improvement effort.
Key Takeaways
- 3:1 is the benchmark — below this, growth is inefficient regardless of revenue growth rate
- Churn is the highest-impact LTV driver — because it sits in the denominator, small churn reductions produce large LTV gains
- Segment the ratio — a healthy blended ratio can mask failing segments destroying value at scale
- Measure at the channel level — different acquisition sources produce fundamentally different LTV:CAC profiles
- Pair with CAC payback period — ratio efficiency without payback speed insight creates cash flow blind spots
- Fix the measurement first — LTV must use gross profit (not revenue), CAC must be fully-loaded, and cohort windows must match actual customer life