

TL;DR
EBITDA margin = EBITDA divided by Revenue, multiplied by 100. It measures operating profitability before interest, taxes, depreciation, and amortization. A good EBITDA margin is 15–25% for SaaS companies at scale, 5–10% for ecommerce, and 12–18% for business services. To improve it: raise gross margin, reduce churn, optimize sales and marketing spend, capture G&A leverage at scale, increase average contract value, and focus R&D on revenue-generating work. This guide covers the full formula, worked example, every industry benchmark, comparisons to gross and net margin, and a six-lever improvement framework.
You look at the revenue number. It is growing. You look at the bottom line. It is not. Something between the two is consuming your operating leverage — and EBITDA margin is the metric that tells you exactly how much is left once you strip out the noise.
EBITDA margin is the operating profitability ratio that cuts through capital structure, tax planning, and accounting policy to show one thing: what percentage of each revenue dollar does this business retain as operating profit?
Get it wrong — or skip it entirely — and you can grow a business that is structurally unprofitable at any scale. Get it right, and you have a clear target for every cost line in the P&L.
What EBITDA Margin Actually Measures
EBITDA stands for Earnings Before Interest, Taxes, Depreciation, and Amortization. The margin version expresses that figure as a percentage of revenue.
Each add-back removes a specific type of cost distortion. Interest reflects financing decisions, not operating performance. Taxes vary by jurisdiction and corporate structure. Depreciation and amortization are non-cash charges that penalize capital-intensive or acquisition-heavy businesses on paper even when cash operations are sound.
What remains is a cleaner view of operating efficiency — the profit generated by the core business before those structural factors enter the picture. This is why EBITDA margin is the standard profitability metric for M&A analysis, fundraising due diligence, and cross-company benchmarking.
How to Calculate EBITDA Margin: Step by Step
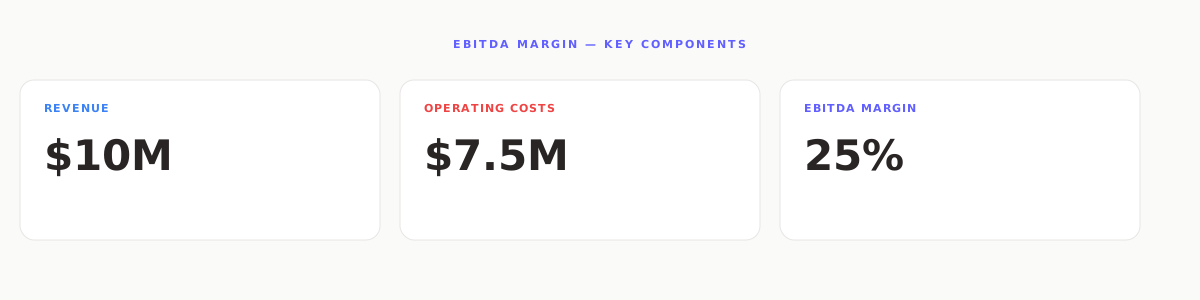
The calculation starts with your income statement. You need five line items: net income, interest expense, income tax expense, depreciation, and amortization. Here is the complete seven-step process.
STEP-BY-STEP CALCULATION
- 1.Start with Net Income from the bottom of your P&L
- 2.Add back Interest Expense — financing cost, not operations
- 3.Add back Income Tax Expense — tax liability from the period
- 4.Add back Depreciation — non-cash charge on tangible assets
- 5.Add back Amortization — non-cash charge on intangibles like software or IP
- 6.The total is your EBITDA
- 7.Divide EBITDA by Total Revenue and multiply by 100
Worked Example: $10M Revenue SaaS Company
A SaaS company reports the following on its annual income statement. This worked example shows how each add-back changes the number at each step.
| Line Item | Amount |
|---|---|
| Total Revenue | $10,000,000 |
| Net Income (starting point) | $400,000 |
| + Interest Expense | $120,000 |
| + Income Tax Expense | $180,000 |
| + Depreciation | $200,000 |
| + Amortization | $100,000 |
| = EBITDA | $1,000,000 |
| EBITDA Margin | 10.0% |
This business retains $0.10 of every revenue dollar as EBITDA. At $10M revenue, that is $1M available to service debt, pay taxes on a normalized basis, and fund capital expenditure — before those obligations reduce the cash position further.
EBITDA Margin Benchmarks by Industry (2026)
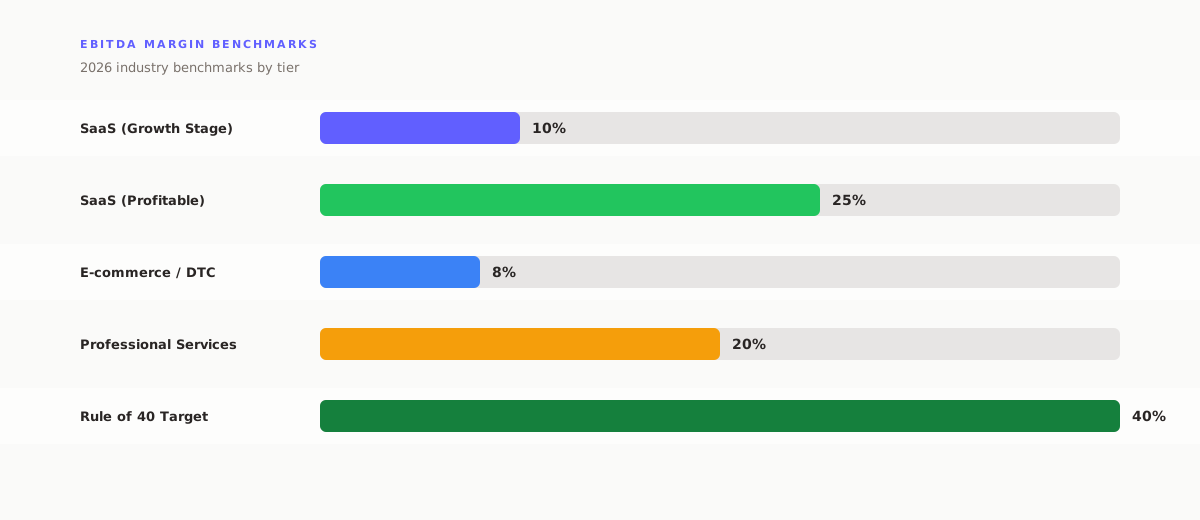
EBITDA margin targets are not universal. A 10% margin is excellent in retail, mediocre in SaaS, and catastrophic for a mature professional services firm billing at high utilization. Always benchmark within your sector and your stage.
SaaS EBITDA Margin Benchmarks
The median public SaaS company reached approximately 9.3% EBITDA margin in 2025 — a dramatic improvement from the negative margins of the 2021–2022 growth era, when most companies ran at −20% to −40% to fund hypergrowth.
For 2026, the benchmarks by stage are:
| ARR Stage | Typical EBITDA Margin | Signal |
|---|---|---|
| Under $5M ARR | −40% to −10% | Pre-scale, expected negative |
| $5M – $20M ARR | −15% to 0% | Growth-stage, burning deliberately |
| $20M – $50M ARR | 0% to 10% | Scale-up, operating leverage emerging |
| $50M – $100M ARR | 8% to 18% | Solid operating leverage visible |
| $100M+ ARR | 15% to 35%+ | Mature — premium valuation territory |
The Rule of 40 ties EBITDA margin directly to growth rate. A SaaS business with 30% revenue growth and 10% EBITDA margin scores 40 — the threshold for premium valuation multiples. See our full guide on the Rule of 40 for SaaS.
Ecommerce and DTC EBITDA Margin Benchmarks
Ecommerce businesses carry inherently lower margins than software because of physical COGS, fulfillment costs, and return rates. A 5–10% EBITDA margin is healthy for a DTC brand. Anything above 15% at scale is exceptional and typically indicates strong brand pricing power or unusually low product return rates.
DTC operators spend disproportionately on paid acquisition. CAC and contribution margin per order are the daily operating levers. EBITDA margin reflects whether the aggregate of those decisions produces real operating profit — or only reported revenue growth.
Professional Services and Agency EBITDA Margin
Services businesses with low overhead and high utilization can achieve 20–30% EBITDA margins. The key variable is labor cost as a percentage of revenue. An agency billing $200K per year per employee at 60% utilization will show very different margins than one billing $350K per year at 85% utilization.
EBITDA Margin vs. Gross Margin vs. Operating Margin vs. Net Margin
These four metrics cut the P&L at different levels. Each answers a different question. Using the wrong one for the wrong purpose leads to the wrong conclusion.
| Metric | What It Excludes | Best Used For |
|---|---|---|
| Gross Margin | OpEx, interest, taxes, D&A | Pricing power, product economics |
| EBITDA Margin | Interest, taxes, D&A | Cross-company benchmarking, M&A valuation |
| Operating Margin | Interest and taxes only | Pure operational efficiency with D&A included |
| Net Margin | Nothing — full picture | True bottom-line profitability after everything |
The gap between gross margin and EBITDA margin tells you how much operating overhead the business carries. A SaaS company with 75% gross margin and 10% EBITDA margin is spending 65 cents of every revenue dollar on sales, marketing, R&D, and G&A. That is the operating cost structure problem — EBITDA margin is what quantifies it precisely.
For a detailed look at gross margin by product line, see our guide to tracking gross margin by product line.
What Is a Good EBITDA Margin? The Full Spectrum
There is no single "good" EBITDA margin. The target depends on business model, stage, and strategic intent. Here is how to read any EBITDA margin number you encounter:
| EBITDA Margin | Signal | Typical Context |
|---|---|---|
| Below −20% | Burning Fast | Early-stage SaaS, funded growth phase |
| −20% to 0% | Growth Mode | Deliberate investment; requires growth to justify burn |
| 0% to 10% | Transitioning | Scale-up, operating leverage beginning to emerge |
| 10% to 20% | Solid | Mature SaaS or services at scale |
| 20% to 35% | Excellent | Premium valuation territory, M&A attractive |
| 35%+ | Best in Class | Category-dominant, monopoly-like efficiency |
One important caution: a very high EBITDA margin can signal under-investment in growth or R&D. A company at 40% EBITDA margin that spends nothing on product or sales may be harvesting a declining business rather than building one. Context always matters — compare margin alongside growth rate, not in isolation.
EBITDA Margin and the Rule of 40
The Rule of 40 is the SaaS framework that links EBITDA margin directly to growth rate. The rule states: Revenue Growth Rate % + EBITDA Margin % must equal or exceed 40.
This forces a clear trade-off conversation. A company growing 50% per year can run at −10% EBITDA margin and still score 40. A company growing 10% per year needs 30% EBITDA margin to reach the same threshold.
RULE OF 40 — EBITDA MARGIN EXAMPLES
Companies scoring 40 or above command premium valuation multiples relative to peers below that threshold. For the complete analysis and benchmark data, read our guide to the Rule of 40 for SaaS.
EBITDA vs. Adjusted EBITDA: The Critical Distinction
Adjusted EBITDA goes further than the base calculation. It adds back items that a company classifies as non-recurring or non-cash: stock-based compensation, restructuring charges, one-time legal settlements, and M&A transaction costs.
Adjusted EBITDA is widely used in private equity, M&A, and private company financing because it attempts to show what the business earns in a normalized operating state. It requires scrutiny.
Stock-based compensation is the most commonly debated add-back. Companies argue it is non-cash and should be excluded. Critics argue it is a real economic cost to shareholders through dilution. For early-stage companies, stock-based compensation can represent 10–20% of revenue — adding it back materially inflates the adjusted number and can make a money-losing business look profitable on paper.
When you see "Adjusted EBITDA" in a fundraising deck or M&A teaser, always request the full reconciliation table. Understand exactly what was added back and why. The gap between GAAP EBITDA and Adjusted EBITDA often reveals the true cost structure of the business.
6 Ways to Improve Your EBITDA Margin
Improving EBITDA margin means either growing revenue faster than operating costs, or reducing operating costs without losing revenue. Both paths work. Here are the six highest-impact levers, ranked by typical magnitude of improvement.
Lever 1: Improve Gross Margin First
EBITDA margin cannot exceed gross margin. If your gross margin is 55%, your EBITDA margin ceiling is 55% — and in practice it will be far lower once operating expenses are added. Gross margin is the foundation everything else builds on.
For SaaS companies, gross margin improvements come from: reducing hosting and infrastructure costs (often 5–8% of revenue for early-stage companies), decreasing support ticket volume through better product design and onboarding, and shifting customers toward self-serve models that reduce professional services cost per customer.
For ecommerce brands, gross margin improvement requires: better supplier negotiations, SKU rationalization (eliminating low-margin products), and reducing return rates — which directly erode gross margin per order. See our guide to contribution margin for ecommerce for the per-order profitability view.
Lever 2: Reduce Customer Churn
Churn destroys EBITDA margin from two directions simultaneously. Direct revenue loss reduces the numerator of the margin calculation. And the cost to replace that churned revenue through re-acquisition inflates sales and marketing expense — which reduces the margin further. A 2% improvement in monthly retention often improves EBITDA margin by 3–5 percentage points once the full acquisition cost impact is accounted for.
Track churn by cohort and identify the customer attributes that correlate with early exits. Tighten ICP targeting to stop acquiring customers who will not reach full lifetime value. See our SaaS churn rate benchmarks guide for segment-specific targets.
Lever 3: Optimize Sales and Marketing Spend Mix
Sales and marketing is typically 30–50% of revenue for growth-stage SaaS companies. It is the single largest operating cost line and the highest-leverage EBITDA margin lever for most businesses. The target is not to spend less — it is to generate more revenue from the same spend by shifting toward higher-efficiency channels.
Inbound, content, and product-led channels typically produce lower CAC than pure outbound. Reducing CAC payback period directly improves EBITDA margin over time. Track CAC payback period alongside EBITDA margin to confirm whether sales efficiency is actually improving or just appearing to.
Lever 4: Capture G&A Leverage at Scale
General and administrative costs should decline as a percentage of revenue as the business scales. Finance, legal, HR, and IT infrastructure do not grow proportionally with revenue. A company that held G&A at 15% of revenue at $5M ARR should target 8–10% at $20M ARR and 5–6% at $50M+ ARR.
The failure mode is headcount growth that tracks revenue linearly. Every G&A hire should be evaluated against specific productivity thresholds. Automate finance and HR operations to avoid adding staff proportionally as transaction volume grows.
Lever 5: Increase Average Contract Value
Raising ACV improves EBITDA margin because most operating costs are fixed or semi-fixed. Doubling ACV from $12K to $24K per customer does not double customer success costs, support costs, or G&A overhead. The incremental revenue flows disproportionately to EBITDA.
Proven levers: tiered pricing with genuine feature differentiation per tier, multi-year contracts that carry a price premium, usage-based pricing that scales with customer growth, and platform packaging that bundles adjacent products. Track ARR per employee as a proxy for value creation per headcount — it should increase as ACV rises.
Lever 6: Focus R&D Spend on Revenue-Generating Work
R&D is the most politically difficult cost line to optimize in SaaS. Engineers resist prioritization. Product teams expand scope. R&D can consume 20–30% of revenue in a growth-stage SaaS company — sometimes exceeding sales and marketing spend.
The approach is not to cut headcount. It is to refocus output. Product teams with tight roadmap discipline and revenue-tied OKRs produce more per dollar spent. Audit time allocation between new feature development and maintenance versus technical debt. Shift the ratio toward revenue-generating initiatives. R&D as a percentage of revenue should decline as ARR grows — not because you hire fewer engineers, but because each engineer produces more revenue impact.
Common EBITDA Margin Mistakes Operators Make
Calculating EBITDA margin correctly is straightforward. The harder problem is interpreting it accurately and avoiding measurement errors that distort the number into something misleading.
Mistake 1: Accepting Adjusted EBITDA Without Examining the Adjustments
Stock-based compensation, one-time costs, and founder salaries can be added back to produce an "adjusted" number that bears no resemblance to cash reality. Disclose adjustments explicitly and treat any EBITDA number received from a third party as unadjusted until proven otherwise.
Mistake 2: Benchmarking Across Business Models
A 10% EBITDA margin is mediocre for a consulting firm and excellent for a grocery chain. Cross-industry comparisons are structurally misleading. Compare within your sector and within your ARR stage. A Series A SaaS company at −15% EBITDA is not underperforming a mature public SaaS company at 25%.
Mistake 3: Treating EBITDA Margin as a Cash Flow Proxy
EBITDA adds back depreciation and amortization but does not add back capital expenditure. A business with $10M EBITDA and $8M in annual capex has only $2M available for debt service and discretionary investment. For capital-light SaaS businesses, EBITDA roughly tracks free cash flow. For capital-intensive businesses, the gap can be enormous. Always check capex relative to EBITDA before drawing cash flow conclusions.
Mistake 4: Ignoring EBITDA in Absolute Dollars
EBITDA margin is a ratio — it can improve even as EBITDA declines in absolute terms, if revenue declines faster. Always track EBITDA in absolute dollars alongside the margin percentage. A business that cuts costs to improve margin while losing revenue is not improving; it is shrinking. The ratio alone conceals that reality.
Mistake 5: Using EBITDA Margin as the Only Profitability Metric
EBITDA margin shows operating efficiency. It does not show cash generation, debt capacity, or tax efficiency. Use it alongside net margin for the full picture, contribution margin for product and channel decisions, and free cash flow margin for capital allocation. No single profitability metric tells the whole story.
How Fairview Surfaces EBITDA Margin in Real Time
Most operators see EBITDA margin once a quarter — after finance closes the books, reconciles accounts, and publishes a report. By that point, the data is 30 to 90 days stale. The decisions that drove the margin have already been made. The window to correct course has passed.
Fairview connects to your billing system, CRM, and financial data to surface EBITDA margin and its contributing metrics — gross margin by product, CAC by channel, headcount cost as a percentage of revenue — on a rolling basis. You see the inputs moving before the output deteriorates.
If a channel's contribution margin drops, you see it in the platform before it shows up in the quarterly P&L. If churn ticks up in a customer segment, the impact on forward EBITDA is visible before it becomes a reported miss. Operating from current data, not historical reports, is the difference between managing profit and reacting to it.
Key Takeaways
- EBITDA margin formula: (EBITDA ÷ Revenue) × 100, where EBITDA = Net Income + Interest + Taxes + Depreciation + Amortization
- Industry benchmarks vary widely: 20–35% for mature SaaS, 5–10% for ecommerce, 12–18% for business services, 3–8% for retail
- Negative EBITDA is normal at early stage: the problem is negative EBITDA without a credible path to positive at scale
- EBITDA margin is not a cash flow proxy: capital expenditure, working capital changes, and debt service sit below the EBITDA line
- The Rule of 40 links EBITDA margin to growth: growth rate plus EBITDA margin should exceed 40 for premium valuation multiples
- The six improvement levers: gross margin, churn reduction, S&M efficiency, G&A leverage, ACV increase, and R&D focus on revenue-generating work
- Adjusted EBITDA requires scrutiny: examine every add-back before accepting the number at face value