

TL;DR
- Inventory turnover = COGS ÷ average inventory. Higher is better, up to the point where stockouts become frequent.
- Target range for most ecommerce categories: 4–8x per year. Food and beverage runs 10–15x. Fashion runs 4–6x.
- Low turnover locks capital in unsold stock, increases carrying costs, and signals demand-supply misalignment.
- Seven levers to improve turnover: demand forecasting, SKU rationalization, dynamic pricing, reorder point optimization, bundle and clearance offers, supplier lead time reduction, and sales velocity tracking.
- The turnover-vs-stockout trade-off is real. Optimize for minimum days on hand without cutting so lean that you miss demand.
What Is Inventory Turnover in Ecommerce?
Inventory turnover measures how many times a business sells through its entire stock during a given period — typically one year. A turnover of 6x means the brand, on average, sells its full inventory six times per year. One turn equals about 60 days of inventory on hand.
For ecommerce operators, inventory turnover is one of the most direct indicators of operational efficiency. It connects purchasing decisions, demand forecasting accuracy, pricing discipline, and sell-through rates into a single ratio. Brands with high turnover carry less working capital in unsold stock, incur lower storage costs, and maintain fresher product cycles.
Brands with low turnover face the opposite: capital tied up in slow-moving product, rising storage costs, and eventually markdowns that compress margin to move stock that should never have been ordered in those quantities.
The Inventory Turnover Formula — and How to Calculate It Correctly
The standard formula:
Inventory Turnover = COGS ÷ Average Inventory
Average Inventory = (Beginning Inventory + Ending Inventory) ÷ 2
Why use COGS, not revenue?
Some sources calculate inventory turnover using revenue instead of COGS. This inflates the ratio and creates inconsistent comparisons across SKUs with different margins. COGS-based turnover is the standard because both COGS and inventory are valued at cost — the same unit.
Annual vs. monthly calculation
Annual calculation is the most common benchmark. For operational decisions — especially in high-velocity or seasonal categories — monthly or quarterly turnover gives a more actionable signal. A fashion brand might run 8x annualized but see turnover drop to 2x in January. That monthly view tells you which months to reduce purchase quantities.
Days Inventory Outstanding (DIO)
Turnover as a ratio is useful for benchmarking. For daily operations, many ecommerce operators prefer Days Inventory Outstanding — the average number of days stock sits before selling.
At 8x annual turnover, DIO is approximately 46 days. At 4x, it is 91 days. This conversion makes the ratio tangible: 91 days of stock means every unit sitting in your warehouse was purchased an average of three months before it sold.
Inventory Turnover Benchmarks by Ecommerce Category
No single benchmark applies across all ecommerce categories. Food and beverage brands must turn inventory fast due to shelf life. Fashion brands balance freshness with the cost of buying too shallow on winning styles. Electronics sit longer due to high unit costs but compress on older model cycles.
| Category | Target Turnover | Approx. Days on Hand | Key Driver |
|---|---|---|---|
| Food & Beverage | 10–15x+ | 24–36 days | Expiration dates, FIFO urgency |
| Health & Supplements | 6–10x | 36–60 days | Subscription demand, expiry risk |
| Electronics & Tech | 6–10x | 36–60 days | Model cycles, markdown risk on older units |
| Fashion & Apparel | 4–6x | 60–90 days | Seasonal relevance, trend cycles |
| Beauty & Skincare | 4–7x | 52–90 days | Expiry management, seasonal launches |
| Home & Decor | 3–5x | 73–121 days | Lower purchase frequency, seasonal peaks |
| Sporting Goods | 4–6x | 60–91 days | Seasonal demand, wide SKU range |
These ranges are targets, not guarantees. A brand with strong subscription penetration in the supplements category might run 12x while a direct competitor runs 5x — both can be healthy depending on their purchasing cadence and supplier terms.
The more useful benchmark is your own historical trend. If your turnover was 6x twelve months ago and is now 4x with the same revenue, that deterioration warrants investigation regardless of where industry benchmarks sit.
Why Low Inventory Turnover Hurts Ecommerce Brands
Low turnover is not a neutral state. It actively damages the business through four compounding mechanisms.
1. Capital tied in non-working assets
Every dollar in unsold inventory is a dollar that cannot fund paid acquisition, product development, or working capital needs. A brand with $500K in inventory at 3x turnover holds an average of $167K in stock at any moment. The same brand at 6x turnover holds $83K. That $84K difference is capital available for growth.
2. Rising carrying costs
Warehouse storage costs, insurance, and inventory financing all scale with the amount of stock on hand. Industry estimates put the total carrying cost of inventory at 20–30% of the inventory value per year — meaning $100K of slow-moving stock costs $20K–$30K annually just to hold, before any markdown to clear it.
3. Increased markdown risk
Slow-moving stock does not stay neutral indefinitely. Fashion items lose relevance. Electronics lose value as newer models release. Food items approach expiration. The longer stock sits, the greater the markdown required to move it — compressing margin on units that were originally purchased at full expected profitability.
4. Demand signal distortion
When excess inventory from a slow period accumulates, it distorts subsequent purchasing decisions. Buyers see high on-hand levels and reduce orders. Then demand returns and the brand stockouts. Low turnover followed by understocking followed by a stockout is one of the most common operating failure patterns in ecommerce, and it starts with inaccurate inventory management.
7 Ways to Improve Inventory Turnover in Ecommerce
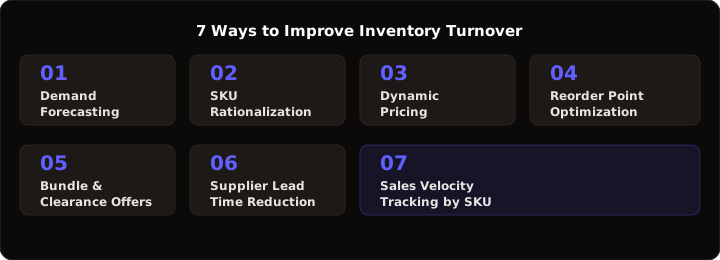
Improving turnover requires either increasing the numerator (COGS, which rises with more sales) or reducing the denominator (average inventory). Most interventions target both simultaneously. The seven tactics below address the full range of levers, from purchasing discipline to pricing strategy.
Tactic 1: Build a Demand Forecasting Process That Accounts for Seasonality
Forecasting errors are the root cause of most inventory problems
Overbuy on slow periods and underbuy on peaks — this is the most common forecasting failure pattern, and it creates both low turnover and missed revenue.
Demand forecasting for ecommerce does not require sophisticated modeling. It requires three inputs: historical sales velocity by SKU, known seasonality patterns, and planned promotional activity. Without these three inputs, purchase quantities are guesses.
The practical starting point is a 13-week rolling sales velocity by SKU. For each product, calculate the average weekly units sold over the trailing 13 weeks. Adjust that baseline upward for upcoming promotions and seasonality peaks, and downward for off-peak periods. This produces a demand estimate that directly informs how many units to order.
The difference between brands that hold 45 days of inventory and those that hold 90 is almost entirely in this forecasting step. Better forecasts mean smaller purchase quantities, which means lower average inventory with the same COGS — and a materially higher turnover ratio.
Sell-through rate as a leading signal
Sell-through rate measures what percentage of purchased inventory sold within a given period. A product with 85% sell-through in 60 days is healthy. One with 40% sell-through in the same window is accumulating. Tracking sell-through weekly by SKU gives early warning of inventory build-up before it becomes a dead-stock problem.
For a deeper look at operating cadence metrics, see the operating intelligence guide for DTC brands.
Tactic 2: Rationalize Your SKU Count to Concentrate Volume
More SKUs almost always means lower average turnover
Each additional SKU requires its own safety stock. Proliferation spreads volume thin across a wider range, reducing per-SKU velocity and average turns.
A Pareto analysis of most ecommerce catalogs reveals a consistent pattern: 20% of SKUs generate 80% of revenue. The remaining 80% of SKUs contribute little revenue but consume a disproportionate share of purchasing budget, warehouse space, and management attention.
SKU rationalization means identifying the bottom quartile of the catalog by contribution to revenue and margin, then making a deliberate decision: either discontinue, archive, or consolidate those SKUs. The result is that the same purchase budget concentrates into fewer, higher-velocity products — improving average turnover across the board.
How to run a SKU profitability audit
For each SKU, calculate three numbers: trailing 90-day revenue, gross margin, and current days on hand. Rank by gross margin contribution. Any SKU in the bottom 20% by gross margin contribution with more than 90 days on hand is a rationalization candidate. For a full SKU analysis framework, see the COGS tracking guide for ecommerce.
SKU rationalization also reduces operational complexity: fewer products mean fewer vendor relationships, simpler warehouse operations, and less cognitive load on the buying team. The compounding benefit is not just better turnover — it is better execution across the entire inventory function.
Tactic 3: Use Pricing to Accelerate Slow-Moving Stock — Without Destroying Margin
Pricing is the fastest turnover lever — used with discipline
A targeted price reduction on slow-moving inventory clears stock and frees warehouse capacity. The risk is margin compression if applied indiscriminately.
Price adjustments on slow-moving stock should be calculated, not reflexive. The decision to discount requires knowing the current cost basis of the inventory, the carrying cost per week of holding it longer, and the minimum price at which clearing the stock generates a better outcome than holding it.
The calculation:
Breakeven Clearance Price = Unit COGS + Remaining Carrying Costs Until Expected Sale
Recommended Clearance Price = Breakeven + Minimum Acceptable Contribution
A unit that cost $30 to produce, costs $0.50 per week to store, and has been sitting for 8 weeks has accumulated $4 in carrying costs. Its clearance floor is $34 plus any minimum margin required. Pricing at $39 clears the stock at a slim but positive contribution, versus the alternative of holding it for another 4 weeks at $36 in cumulative carrying cost and then clearing at $34 at break-even.
Bundles are an often-overlooked pricing mechanism for inventory clearance. Pairing a slow-moving SKU with a high-velocity product at a marginal bundle price can move the slow unit without the perception damage of a direct markdown on the product page.
Dynamic pricing rules for ecommerce
Set a days-on-hand trigger for each category: when any SKU exceeds the target DIO by 25%, apply a 10–15% price reduction. When it exceeds target DIO by 50%, apply a 20–25% reduction. When it exceeds DIO by 100%, execute a bundle or flash clearance. This systematic approach replaces ad hoc decisions with a rules-based pricing discipline.
The relationship between pricing discipline and contribution margin is explored in depth in the contribution margin formula guide.
Tactic 4: Optimize Reorder Points to Reduce Average On-Hand Inventory
Reorder point discipline is the supply-side version of demand forecasting
Setting reorder points too early means chronically high on-hand stock. Too late means stockouts. The formula eliminates guesswork from this decision.
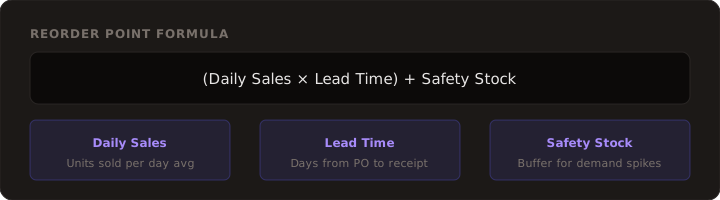
The reorder point formula determines when to place the next purchase order:
Reorder Point = (Daily Sales × Lead Time) + Safety Stock
Safety Stock = Z-score × Standard Deviation of Demand × Square Root of Lead Time
For most ecommerce operators, a simplified version works well: calculate the average daily sales velocity for a SKU over the trailing 30 days, multiply by supplier lead time in days, and add a safety stock buffer of 10–20% of that number. The result is the inventory level at which a purchase order must be placed to avoid stockouts during the replenishment window.
Most ecommerce brands set reorder points manually and rarely revisit them. As velocity changes — due to seasonal shifts, marketing spend changes, or competitor dynamics — the reorder point needs to change too. A reorder point calibrated to Q4 holiday demand will over-stock a brand through Q1 and Q2 if left unchanged.
Order frequency vs. order size
One of the most effective structural changes to improve turnover is shifting from large, infrequent orders to smaller, more frequent orders. Buying 90 days of inventory in one order means average on-hand stock of 45 days. Buying 30 days of inventory monthly means average on-hand stock of 15 days — tripling the effective turnover ratio with no change in annual COGS.
This approach is constrained by supplier MOQs and the economics of freight. But even partial shifts — moving from quarterly orders to monthly orders for fast-moving SKUs — can improve turnover by 1–2x without any change in demand.
Tactic 5: Offer Bundles and Clearance Promotions for Aging Stock
Aging stock needs active intervention — not patience
Products sitting beyond their target DIO are not going to turn themselves. Bundles, flash sales, and kit offers are the mechanical levers that move them.
Clearance promotions are often treated as failure events — a sign that the purchasing team bought the wrong thing. Reframe them: clearance is a planned margin-recovery mechanism for inventory that has aged past its target DIO. Every category has aging stock; the question is whether the brand moves it actively or lets it accumulate.
Effective clearance tactics for ecommerce:
- Email-based flash sales to past customers. Existing customers convert at 3–4x the rate of cold traffic on clearance offers. A flash sale to a list of 20,000 past buyers can clear hundreds of units in 24 hours without public markdowns that train new customers to wait.
- Product bundles. Pair a slow-moving unit with a best-seller at a bundle price that improves per-order revenue. The slow-moving unit moves at a lower standalone price without creating a visible markdown on its product page.
- Subscription seed units. If the product is subscription-eligible, offer aging stock as a free trial unit in subscription sign-up flows. The COGS is absorbed as a customer acquisition cost against future LTV.
- B2B liquidation. For products that will not clear through DTC channels at acceptable margin, liquidation to wholesale buyers at cost or slightly below avoids the full write-off and recovers part of the investment.
Tactic 6: Reduce Supplier Lead Times to Lower Safety Stock Requirements
Lead time is the hidden driver of inventory bloat
A brand with 60-day supplier lead times must hold twice as much safety stock as one with 30-day lead times, even with identical demand velocity.
Lead time directly determines how much inventory must be held at any moment. The reorder point formula makes this explicit: every extra day of supplier lead time increases the required on-hand stock by the daily sales rate. For a product selling 50 units per day, reducing lead time by 15 days reduces required safety stock by 750 units — which at $20 COGS per unit represents $15,000 in freed working capital per SKU.
Lead time reduction strategies for ecommerce operators:
- Negotiate domestic warehousing with overseas suppliers. Some manufacturers can hold finished goods in domestic 3PL facilities, cutting functional lead time from 45 days to 5–7 days. This requires minimum commitment levels but dramatically changes inventory math.
- Qualify a second supplier. Single-source dependency forces brands to order far in advance due to risk. A qualified backup supplier reduces that risk, allowing tighter reorder windows.
- Move to air freight for fast-moving SKUs during high-velocity periods. The freight premium is often smaller than the carrying cost of the additional inventory required to buffer slow sea freight lead times.
- Shift to vendor-managed inventory for core SKUs. Some suppliers will manage replenishment directly against shared sales data, taking the forecasting and order placement burden off the brand.
Tactic 7: Track Sales Velocity by SKU Weekly — Not Monthly
Monthly reporting hides weekly deterioration until it is too late
A SKU can shift from healthy to dead stock within three weeks. Monthly reviews catch that change eight weeks after it starts.
Most ecommerce operators review inventory metrics monthly. Monthly reporting smooths out the weekly variance that contains the most actionable signals. A product that sold 400 units in week one and 100 units in week four is showing a 75% velocity decline that a monthly average would obscure. That decline needs a response — a pricing adjustment, a marketing push, or a decision to pause reordering — within days, not weeks.
The weekly sales velocity review should cover three metrics per SKU: units sold that week, current on-hand quantity, and weeks of supply remaining at current velocity. Any SKU with more than 10 weeks of supply triggers a review. Any SKU with fewer than 3 weeks of supply triggers a reorder check.
This review does not require a dedicated analyst. It requires a connected data feed from your ecommerce platform to a reporting layer that computes these three numbers automatically. The brands that run this review weekly catch demand shifts before they create either stockouts or dead stock.
The weekly operating cadence framework is detailed in the weekly operating report template.
The Inventory Turnover vs. Stockout Trade-off
Higher inventory turnover is not unconditionally good. Pushed too far, it produces the other problem: stockouts. A brand that cuts inventory to the absolute minimum in pursuit of high turnover will regularly run out of stock during demand spikes, holiday surges, or supply delays.
Stockouts carry real costs that turnover metrics do not capture directly:
- Lost revenue. A stockout on a high-velocity product can cost 2–4 days of that product's revenue while replenishment arrives.
- Marketplace ranking penalties. Amazon, Walmart Marketplace, and other platforms penalize out-of-stock products with reduced search visibility. Organic ranking recovery after a stockout can take 4–6 weeks.
- Customer defection. A customer who finds a product out of stock purchases from a competitor. Some percentage of those customers do not return.
The operating target is optimal turnover — not maximum turnover. Define a stockout rate threshold for each product category (for example, fewer than 2 stockout events per SKU per quarter) and treat that as a constraint on how aggressively you reduce inventory. Turnover improvements that push the stockout rate above the threshold require safety stock recalibration before proceeding.
Inventory Metrics to Track Alongside Turnover
Inventory turnover is a summary metric. The operational metrics below provide the granular signals that explain why turnover is where it is — and where to intervene.
| Metric | Formula | What It Tells You | Review Frequency |
|---|---|---|---|
| Sell-through rate | Units Sold ÷ Units Received | How well purchased inventory is converting to sales | Weekly |
| Days Inventory Outstanding | 365 ÷ Turnover Ratio | Average days stock sits before selling — operational proxy for turnover | Weekly |
| Dead stock percentage | Units unsold >90 days ÷ Total Units | Share of inventory at markdown or write-off risk | Monthly |
| Stockout rate | SKUs out of stock ÷ Total Active SKUs | Whether turnover optimization is creating supply gaps | Weekly |
| Weeks of supply | On-Hand Inventory ÷ Weekly Sales | How many weeks of current velocity is on hand per SKU | Weekly |
| Inventory carrying cost | Avg Inventory × 20–30% | Annualized cost of holding current inventory levels | Quarterly |
The most effective inventory review cadence tracks sell-through rate and weeks of supply weekly, reviews dead stock percentage monthly, and calculates carrying cost quarterly to quantify the financial benefit of turnover improvements.
For a full D2C metrics framework that integrates inventory performance with margin and channel analytics, see the D2C unit economics metrics guide.
How Fairview Surfaces Inventory Turnover Data
Fairview's operating intelligence platform connects to Shopify and inventory management systems to compute inventory turnover, sell-through rate, days on hand, and dead stock percentage by SKU — updated weekly.
The weekly operating report surfaces:
- Turnover ratio by product category versus 4-week average and prior period
- SKU-level weeks of supply with flags for over-stocked (>12 weeks) and under-stocked (<3 weeks) products
- Dead stock percentage trending over 90, 60, and 30 days
- Sell-through rate by SKU for the trailing 4 weeks
- Automated alert when category-level turnover drops below the configured floor
The practical outcome: the operations team stops spending two hours per week pulling inventory reports and starts spending that time acting on the signals those reports contain. Every inventory review meeting starts with the same data, in the same format, without a manual pull. The decisions get faster and the data gets acted on before it becomes a crisis.
For brands that also want to connect inventory performance to margin and channel profitability, see the operating intelligence for ecommerce guide.
Key Takeaways
- Inventory turnover = COGS ÷ average inventory. The target range for most ecommerce categories is 4–8x per year, with food and beverage running higher and home decor running lower.
- Days Inventory Outstanding (DIO) converts the ratio into an operational metric: 365 ÷ turnover. Target DIO is 45–90 days for most categories.
- Low turnover locks capital in unsold stock and generates 20–30% annual carrying costs on average inventory value.
- The seven improvement levers: demand forecasting, SKU rationalization, pricing discipline, reorder point optimization, clearance promotion, lead time reduction, and weekly velocity tracking.
- Do not optimize turnover in isolation. Track stockout rate as a constraint — turnover improvements that drive stockouts above acceptable thresholds require safety stock recalibration.
- Weekly velocity reviews catch demand shifts before they create dead stock. Monthly reporting is too slow for operational inventory decisions.
- The difference between a 4x and 8x turnover business at $5M in annual COGS is $625K less capital tied in inventory — a material working capital advantage.
Siddharth Gangal
Founder, Fairview. Writes about D2C profitability, inventory operations, and the data systems that separate brands growing with discipline from those growing into losses.
LinkedIn →