TL;DR
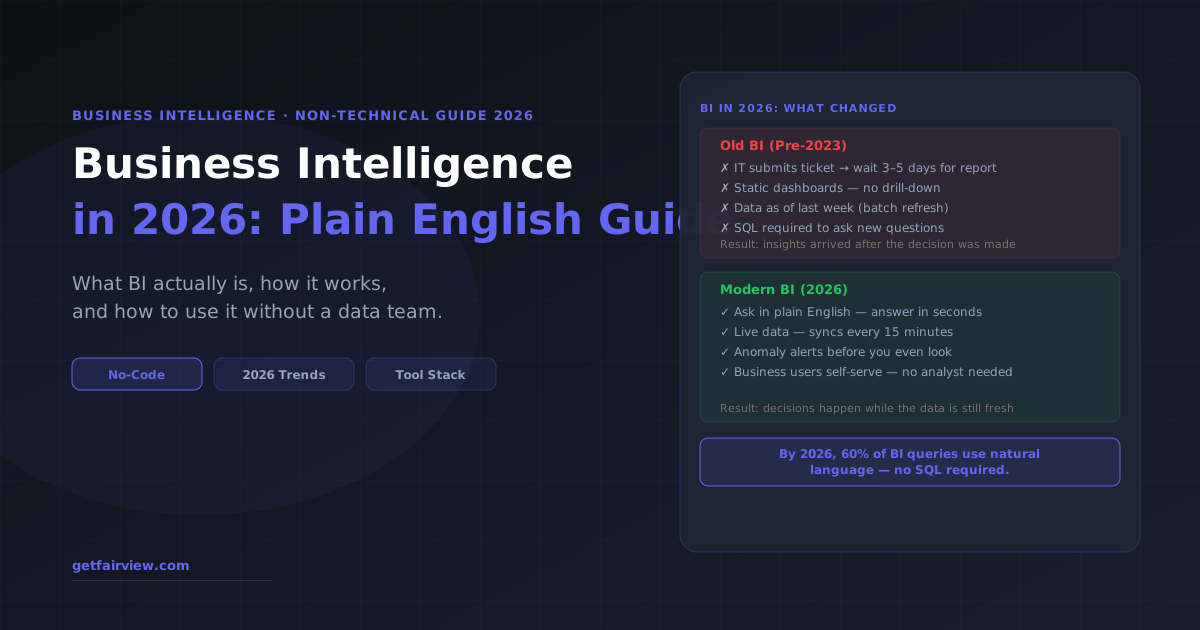
Business intelligence (BI) is the process of collecting data from across your business, organizing it in one place, and presenting it in a way that helps you make faster, better decisions. In 2026, modern BI tools require no SQL and no data team — business users can ask questions in plain English and get answers in seconds. The gap between "having data" and "using data" has collapsed.
What Is Business Intelligence?
Business intelligence is not a specific software product. It is a discipline — the practice of using data to make business decisions instead of guessing.
The term covers everything from pulling a sales report in a spreadsheet to using AI-powered tools that automatically flag when your margin on a product crosses a threshold you care about. What all of it has in common: data goes in, understanding comes out.
In practice, most people mean one of three things when they say "BI":
- The process — collecting, cleaning, and structuring your business data so it can be analyzed
- The tooling — dashboards, reporting platforms, analytics software that makes the data visible
- The output — the reports, charts, alerts, and insights the business actually uses
All three layers matter. A company that has great tooling but garbage data will produce beautiful charts that are wrong. A company that has clean data but no way to surface it to decision-makers will still make decisions by gut.
The modern definition of BI in 2026 extends beyond historical reporting. According to Gartner, business intelligence now encompasses the full spectrum from descriptive analytics (what happened) through prescriptive analytics (what you should do about it). Most companies are somewhere in the middle — they can tell you what happened last quarter but struggle to know what to do about it this week.
BI vs Plain Reporting: What Is the Actual Difference?
Many operators think they have BI because they have dashboards. A dashboard is not BI — it is one output of BI. The distinction matters because it changes what you should build and buy.
| Dimension | Plain Reporting | Business Intelligence |
|---|---|---|
| Scope | One data source (e.g., your CRM only) | Multiple sources unified (CRM + ads + finance + ops) |
| Freshness | Weekly or monthly exports | Near real-time (15-minute to hourly syncs) |
| Interactivity | Static — you see what someone built | Interactive — you drill down, filter, cross-reference |
| Questions answered | The questions you thought to ask last month | Any question about your data, including new ones |
| Who can use it | Whoever has spreadsheet access | Any business user, through self-service interfaces |
| Alerts | None — you catch problems when you look | Proactive anomaly detection — you get notified first |
The practical difference is this: reporting tells you what happened after you go look. BI tells you what matters before you think to ask.
Fairview gives operators revenue and margin intelligence without a data team.
Connect your CRM, ad platforms, and finance data in one place — and get answers, not dashboards.
See how it works →The 4-Layer BI Stack Explained
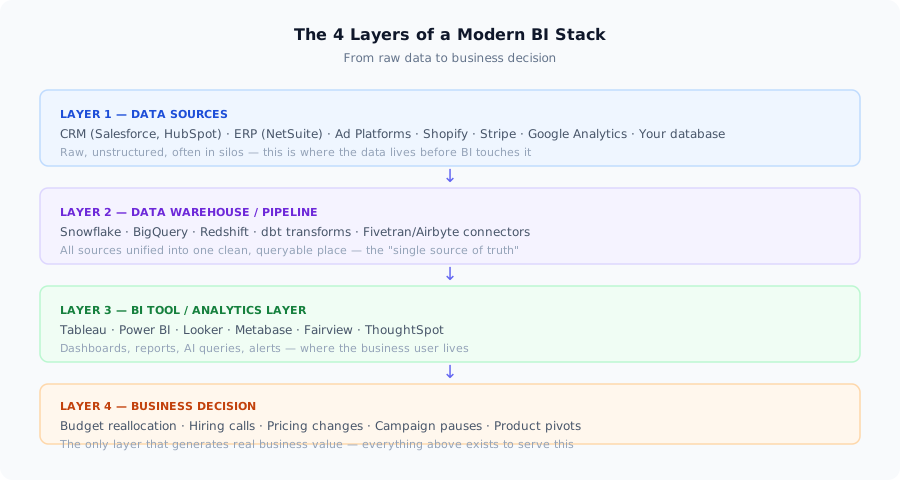
Modern BI runs on a stack of four distinct layers. Most BI tools handle one or two of these layers — a few platforms handle all four. Understanding the stack helps you figure out where you have gaps and what to buy.
Layer 1: Data Sources
Every piece of business data you generate lives somewhere. Your CRM holds deal and contact data. Your ad platforms hold spend and performance data. Your Shopify or e-commerce platform holds order and return data. Your accounting software holds revenue and cost data.
The problem: these systems do not talk to each other. A sales rep in Salesforce has no idea what marketing spent to acquire the lead they are closing. A finance team in QuickBooks has no idea which channel drove the revenue they are reporting. Data lives in silos — and every silo costs you insight.
Layer 2: Data Pipeline and Warehouse
A data pipeline extracts data from each source, transforms it into a consistent format, and loads it into a central location — a data warehouse. Common warehouses include Snowflake, Google BigQuery, and Amazon Redshift. Common pipeline tools include Fivetran and Airbyte.
This layer is technical. It requires a data engineer to set up and maintain. But once it exists, every BI tool and analyst in the company can access all your data in one place — without building separate integrations for each tool.
In 2026, many modern BI platforms (including operating intelligence tools like Fairview) handle the pipeline layer for you, with pre-built connectors to the most common business systems. You connect your accounts; the platform handles the syncing.
Layer 3: BI Tool or Analytics Layer
This is the layer most people mean when they say "BI." Tableau, Power BI, Looker, Metabase, and ThoughtSpot all live here. This layer takes the unified data from the warehouse and makes it queryable, visualizable, and shareable.
In 2026, the best tools at this layer use AI to let non-technical users ask questions in natural language — "why did our CAC spike in March?" — and surface structured answers without anyone writing SQL. According to research from Stellium Consulting, by 2026, 60% of BI queries use NLP interfaces.
Layer 4: Business Decision
This is the layer that most BI vendors forget to talk about. All of the infrastructure above exists to produce one thing: a better business decision. If you have a beautiful Tableau dashboard that nobody looks at before making a call, you have spent a lot of money on Layer 3 without reaching Layer 4.
The gap between Layer 3 and Layer 4 is the most important gap to close. It is a culture and workflow problem as much as a tooling problem. The companies that get value from BI are the ones that build "data in the room" into their decision-making process — not as a separate step, but as the default.
The 4 Types of Business Intelligence
BI tools vary not just in how they display data, but in what kind of questions they can answer. The industry recognizes four types, which form a maturity ladder:
Question it answers: What happened?
Example: Revenue last quarter was $2.4M, down 8% from the prior quarter. The West region underperformed by 22%.
Tools: Excel, Google Sheets, Tableau, most traditional dashboards
Question it answers: Why did it happen?
Example: Revenue dropped because deal velocity slowed — average sales cycle extended from 34 to 52 days in the Enterprise segment.
Tools: Looker, Power BI with drill-down, ThoughtSpot
Question it answers: What will likely happen?
Example: Based on current pipeline velocity and historical close rates, you will likely finish Q3 at $2.1M — 12% below target.
Tools: Sales forecasting platforms, AI-powered BI, Fairview
Question it answers: What should we do?
Example: Shift $18K from Google Paid Search (true ROI: -8%) to Meta Retargeting (true ROI: +34%). Estimated impact: +$9K net margin per month.
Tools: Operating intelligence platforms, AI-native BI
Most companies operate at Type 1 or Type 2. The opportunity — and where BI investment pays off most — is getting to Type 3 and Type 4, where the data tells you what to do, not just what happened.
What Changed in 2026: 5 Shifts That Matter
BI has existed since the 1990s. But the version of BI that most operators encounter today looks almost nothing like what existed five years ago. Here are the five changes that matter most for non-technical users:
1. Natural Language Queries Became the Default
The biggest barrier to BI adoption was always the requirement to know SQL — or to wait for someone who did. In 2026, that barrier is gone. Leading platforms let you type "show me CAC by channel for the last 90 days" and return a formatted chart in under three seconds. No query language, no data analyst in the loop, no ticket queue.
2. Self-Service Replaced the IT Request Model
The old BI model required business users to submit data requests to IT or analytics teams, who would build reports and return them days later. By the time the report arrived, the decision it was meant to inform had often already been made — with incomplete information. Self-service BI eliminated this bottleneck. Today's platforms are built for the business user first, with interfaces that require no technical training.
3. Real-Time Data Replaced Batch Exports
Until recently, most BI ran on nightly batch exports — yesterday's data, at best. In 2026, most modern platforms sync data in near real-time, with 15-minute to hourly refresh rates on most connectors. For operators running paid acquisition campaigns or watching daily revenue targets, this shift from "yesterday's data" to "this morning's data" changes what decisions you can actually make.
4. Anomaly Detection Became Proactive
Old BI required you to go look at a dashboard to find a problem. New BI surfaces problems before you go looking. AI-powered anomaly detection monitors your key metrics continuously and sends alerts when something breaks — a sudden CAC spike, an unusual return rate, a revenue dip on a specific SKU. You find out about the problem before it compounds.
5. Margin and Profitability Became First-Class Metrics
Traditional BI was built for revenue teams — tracking pipeline, close rates, and top-line growth. In 2026, operators need margin intelligence alongside revenue intelligence. The economics of running a business have tightened enough that "we grew revenue" is no longer sufficient — "we grew profitable revenue" is what matters. Modern platforms are catching up, adding cost data and profitability views alongside the traditional revenue metrics.
BI for Non-Technical Operators: Where to Start
If you run a business or a revenue function without a dedicated data team, here is a practical path to getting value from BI in 2026 — without hiring a data engineer first.
Step 1: Define Your 5 Most Important Questions
Before buying or building anything, write down the five questions you most often wish you could answer faster. Common ones for operators:
- Which marketing channel is generating profitable customers — not just leads?
- What is my current gross margin by product line or SKU?
- Which deals in my pipeline are most likely to close this quarter?
- Where is my CAC trending versus my LTV, and is it widening or narrowing?
- What will my revenue look like at the end of this month if current trends hold?
These five questions define your actual BI requirements. Any platform you evaluate should be able to answer all five. If it cannot, it is the wrong platform for your situation — regardless of how many features it has.
Step 2: Audit Your Data Sources
List every system your business currently uses that holds relevant data. For most operators, this list includes:
- CRM (Salesforce, HubSpot, Pipedrive)
- Ad platforms (Google Ads, Meta, LinkedIn)
- E-commerce or billing (Shopify, Stripe, Recurly)
- Finance (QuickBooks, Xero, NetSuite)
- Product analytics (Amplitude, Mixpanel, PostHog)
The systems that contain data relevant to your five questions are the integrations you need from a BI platform. Start there — not with a wish list of 30 connectors you might need someday.
Step 3: Choose a Platform That Matches Your Maturity
Not every BI platform is right for every company. A 200-person company with a full data team has different needs from an 8-person operator who needs answers, not infrastructure.
| Company Size | Data Team | Recommended BI Approach |
|---|---|---|
| 1–20 people | None | Pre-built connectors + self-service platform (Fairview, Metabase) |
| 20–100 people | 1 analyst | Self-service BI + light warehouse (BigQuery + Looker Studio or Power BI) |
| 100–500 people | Small data team | Full warehouse + BI layer (Snowflake + Tableau or Looker) |
| 500+ people | Dedicated team | Enterprise BI stack with governance (Snowflake + Looker/ThoughtSpot + dbt) |
Step 4: Start With One Dashboard, Not Twenty
The most common BI implementation failure is building too many dashboards before anyone has proven they will be used. Start with a single revenue and pipeline health dashboard covering your five most important questions. Run it for 60 days. Fix what is wrong with it. Add a second dashboard only after the first one is embedded in your weekly decision-making process.
Step 5: Make BI Part of Your Review Cadence
Data that nobody looks at generates no value. The highest-ROI BI investment is not a better tool — it is a weekly review cadence where the business team actually opens the dashboards, asks questions, and uses what they find to make decisions. Build the meeting before you build the dashboard.
How Fairview Fits Into Modern BI
Fairview is built for revenue and operations leaders who need the outcomes of enterprise BI without the infrastructure investment. Rather than requiring you to build a data warehouse, hire a data engineer, and configure a separate BI tool, Fairview handles the data layer and the analytics layer in one product.
Specifically, Fairview addresses the gap that most traditional BI tools leave open: the connection between your revenue data and your profitability. Most BI platforms can tell you that revenue grew. Fairview tells you whether that revenue grew profitably — factoring in COGS, channel costs, returns, and overhead allocation.
Key capabilities that differ from standard BI:
- True channel ROI — not just attributed revenue, but contribution margin after ad spend, COGS, and fulfillment
- Margin by SKU or product line — not just overall gross margin, but broken down to the product level
- Revenue and pipeline in one view — CRM pipeline data alongside actuals, so you see both forecast and reality together
- Proactive anomaly alerts — when a metric breaks, you find out before the weekly review
If your team spends more time pulling data together than using it to make decisions, that is the problem Fairview is designed to solve. Book a demo to see how it works with your data.
Not anymore. Modern BI platforms are built for self-service. Non-technical users can build dashboards, set alerts, and ask natural-language questions without writing a single line of SQL. That said, a data engineer or analyst is still valuable for setting up the initial data pipeline and warehouse — unless you use a platform like Fairview that handles that layer for you.
Conversational analytics is the dominant 2026 trend. By 2026, an estimated 60% of BI queries use natural language interfaces. Users type questions like "why did revenue drop in March?" and get structured answers in seconds — no SQL, no analyst queue, no waiting.
Key Takeaways
- Business intelligence is a discipline, not a product — it covers the process of turning raw data into better decisions.
- The modern BI stack has four layers: data sources, data pipeline/warehouse, BI tool, and business decision. Most companies underinvest in Layer 4 (actually using the data).
- The four types of BI form a maturity ladder: descriptive → diagnostic → predictive → prescriptive. Most operators sit at Type 1 or 2.
- In 2026, five shifts changed BI for non-technical users: natural language queries, self-service, real-time data, proactive anomaly detection, and margin visibility.
- Non-technical operators should start with five key questions, audit their data sources, match their platform to their maturity, and build one dashboard before twenty.
- The highest-ROI BI investment is a review cadence that actually uses the data — not a better tool.
Ready to get operating intelligence, not just dashboards?
Fairview connects your revenue, margin, and pipeline data in one place — and surfaces what matters, before you go looking.
Book a demo →