Most brands know their blended margin. Few know their true margin. The difference between those two numbers is where profit leaks live — and where margin intelligence begins.
Blended margin is the single percentage finance reports at month-end: total revenue minus total direct costs, divided by revenue. It is accurate, auditable, and useful for board reporting. It is also dangerously incomplete for operating decisions. A 48% blended gross margin can conceal a channel running at 12% and another at 62%. The operator who sees only the blended number makes channel allocation decisions without knowing which channels are profitable and which are not.
Margin intelligence is the practice of tracking profit at a level of granularity and frequency that matches how operating decisions are actually made. It is not a replacement for financial reporting. It is a separate layer — one that answers different questions on a different cadence. This guide defines what margin intelligence is, maps the four layers most operators miss, explains why blended margin lies, and shows how to build a margin intelligence practice in your business.
What Is Margin Intelligence?
Margin intelligence is the continuous tracking of profit by the dimensions that drive operating decisions: channel, product line, customer segment, and cohort. It updates frequently — daily or weekly, not monthly — and surfaces not just what margin is, but where it is changing and what is causing the change.
The term is often used loosely. Some vendors apply it to any dashboard that shows a profit number. Some finance teams use it as a synonym for margin analysis. Neither captures what the term means in practice. Margin analysis is typically periodic and retrospective. Margin intelligence is continuous and operational. The distinction is not semantic — it determines whether the output can guide a decision that needs to be made this week.
That definition has three components that matter independently. Continuous visibility means the data refreshes frequently enough to act on — not at month-end close. Segmented granularity means margin is broken down by channel, product, and customer, not reported as one aggregate number. Action triggering means the layer flags changes and anomalies before they compound, with enough specificity to assign a response. A margin intelligence layer that does all three is qualitatively different from a margin report that does one or two.
For a deeper look at how margin intelligence functions as a metric layer between your data sources and your decisions, see our post on margin intelligence explained.
The 4 Layers of Margin Intelligence
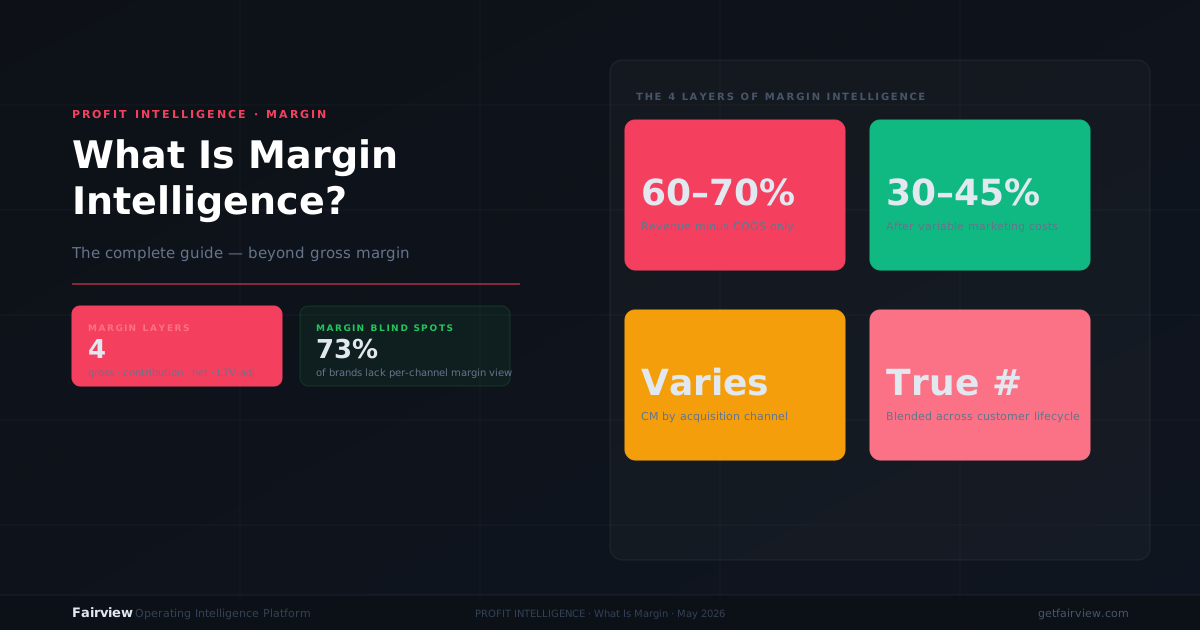
Most operators track one margin number and assume it tells the full story. It does not. Margin is a stack of four layers, and each layer reveals costs the previous layer hides. Understanding the four layers is the foundation of margin intelligence.
Layer 1: Gross Margin
Gross margin is revenue minus direct cost of goods sold (COGS). It is the first and most commonly tracked margin layer. For a DTC brand, COGS includes product cost, freight-in, and packaging. For a SaaS company, COGS includes hosting, payment processing fees, and customer support labor directly attributable to delivery.
Gross margin is useful for comparing product-line profitability at a high level. It is not useful for channel decisions, because it does not include the variable costs that differ by channel — ad spend, fulfillment, return processing, and payment fees. Two channels with identical gross margins can have wildly different contribution margins once those variable costs are applied.
Layer 2: Contribution Margin
Contribution margin is gross margin minus variable costs. Variable costs are the costs that scale with revenue and differ by channel: ad spend, shipping and fulfillment, payment processing fees, and return-related costs. Contribution margin answers the question: after direct product costs and variable channel costs, how much does this channel contribute to covering fixed costs and generating profit?
Contribution margin is the most decision-relevant layer for operators making weekly channel and budget decisions. It is the layer that reveals whether a high-revenue channel is actually profitable. A channel with strong gross margin but high ad spend and return rates can easily run at negative contribution margin — meaning every sale loses money. For a detailed guide on calculating this layer, see contribution margin by channel.
Layer 3: Net Margin
Net margin is contribution margin minus fixed and operating costs: rent, salaries, software subscriptions, and other overhead. It answers the question: after all costs are applied, what percentage of revenue remains as profit?
Net margin is the number investors and boards care about. It is less useful for weekly operating decisions because fixed costs do not change week to week. The operator cannot reallocate rent in response to a channel margin drop. But net margin matters for strategic decisions: pricing changes, product-line expansion, and market entry. A product line with positive contribution margin but negative net margin after overhead allocation is not viable long-term.
Layer 4: Channel Margin
Channel margin is the most granular layer: profit broken down by SKU, acquisition channel, customer segment, and cohort. It applies all the previous layers at a dimensional level that matches how operators actually allocate resources. Which SKU is most profitable after returns and fulfillment? Which acquisition channel produces customers with the highest LTV? Which customer segment has the best net margin after support costs?
Channel margin is where the action lives. It is also the layer that requires the most data infrastructure: transaction-level revenue, channel-specific cost allocation, and attribution logic that connects marketing spend to the revenue it produced. Most operators do not have this layer. Those who do make faster, more defensible decisions.
| Layer | Formula | What it reveals | What it hides |
|---|---|---|---|
| Gross margin | Revenue − COGS | Product-line profitability at a high level | Channel variable costs, fixed costs |
| Contribution margin | Gross margin − variable costs | Channel profitability after ad spend, fulfillment, returns | Fixed and operating costs |
| Net margin | Contribution margin − fixed costs | Overall business profitability after all costs | Channel and product variance |
| Channel margin | Net margin by SKU, channel, segment | Profitability at the dimension operators can act on | Nothing — this is the full picture |
How Margin Intelligence Differs from Profit Analytics
Profit analytics and margin intelligence sound similar. They are not the same thing, and the difference determines whether the output drives operating decisions or sits in a quarterly deck.
Profit analytics is retrospective and aggregate. It answers "what was our profit last quarter?" It is produced by finance teams, reviewed by boards, and used for period-end reporting. The cadence is monthly or quarterly. The granularity is company-level. The output is a report.
Margin intelligence is continuous and segmented. It answers "which channel is margin-positive right now, and where is profit leaking?" It is used by operators, reviewed weekly, and drives resource allocation decisions. The cadence is daily or weekly. The granularity is channel, product, and segment. The output is a signal that triggers action.
The table below maps the structural differences:
| Dimension | Profit analytics | Margin intelligence |
|---|---|---|
| Cadence | Monthly or quarterly | Daily or weekly |
| Granularity | Company-level aggregate | Channel, SKU, segment, cohort |
| Question it answers | "Were we profitable?" | "Which part is leaking, and what do we do?" |
| Primary user | Finance, board, investors | COO, operator, founder |
| Output type | Report or deck | Dashboard alert with recommended action |
| Data source | Accounting tool (month-end close) | Accounting + payments + CRM + ad platforms (continuous) |
Both layers are necessary. Profit analytics serves compliance, reporting, and investor communication. Margin intelligence serves operating decisions. A business with strong profit analytics but no margin intelligence can report healthy quarterly numbers while bleeding margin through channels that are never examined at the right granularity.
Why Blended Margin Lies
Blended margin is the single most dangerous number in operating finance. It looks precise. It is mathematically correct. And it systematically conceals the variance that matters most for decisions.
Consider a DTC brand with three channels: organic search, paid social, and paid search. The blended gross margin is 48%. That number is real. But here is what it hides:
- Organic search: 62% gross margin, minimal ad spend, low return rate. This channel is highly profitable.
- Paid social: 38% gross margin, high ad spend, elevated return rate. At the contribution margin layer, this channel is barely break-even.
- Paid search: 28% gross margin, very high ad spend, competitive keyword costs. This channel is losing money on every sale after variable costs.
The blended 48% tells the operator the business is healthy. The channel-level view tells the operator to reallocate paid search budget to organic and paid social immediately. The two views produce opposite decisions. The operator who sees only the blended number continues funding a loss-making channel.
This pattern is not rare. In our engagements with growth-stage operators, the gap between blended margin and the worst-performing channel typically ranges from 15 to 30 percentage points. A channel running at 22% contribution margin can hide inside a 47% blended average without ever triggering a review — because the aggregate number looks acceptable.
The hidden costs that blended margin conceals fall into four categories:
- Channel-specific ad spend. Blended margin does not allocate ad spend to the revenue it produced. A channel with high revenue and high ad spend looks the same as a channel with high revenue and low ad spend at the blended level.
- Return and refund rates. Return rates vary dramatically by channel and product line. A channel with 8% returns and a channel with 22% returns contribute very different net margins. Blended margin averages them into one number.
- Fulfillment and shipping variance. Shipping costs differ by geography, product weight, and carrier. A channel that sells heavy products to distant customers has higher fulfillment costs than one selling light products locally. Blended margin does not surface this.
- Payment processing and platform fees. Different channels and platforms charge different processing fees. A channel running through a high-fee marketplace can lose 5–8 points of margin to fees that do not appear in the gross margin calculation.
The fix is not to abandon blended margin. It is to treat blended margin as a starting point, not an endpoint. The operating decision requires the segmented view. For a structured approach to finding these hidden costs, see our guide on profit leaks.
3 Signs Your Business Needs Margin Intelligence
Not every business needs a dedicated margin intelligence layer. Early-stage companies with one channel and one product line can track margin in a spreadsheet. But three signals indicate that the spreadsheet approach is no longer sufficient — and that margin intelligence has become a competitive necessity.
Sign 1: You Optimize for Revenue Instead of Profit
If your weekly review focuses on revenue growth, pipeline volume, or MQL count — without a corresponding profit metric — you are optimizing for the wrong signal. Revenue is easy to measure and easy to report. It is also the metric that most reliably leads to margin erosion when pursued without a cost layer attached.
The specific symptom: your team celebrates a 30% revenue increase without knowing whether the new revenue is margin-accretive. The channel that drove the growth may have high CAC, high returns, or low ACV. Revenue growth that destroys margin is not growth — it is scaling a loss. Margin intelligence surfaces the profit dimension alongside revenue, so the operator can distinguish between growth that builds the business and growth that erodes it.
Sign 2: You Make Weekly Decisions with Month-Old Cost Data
Finance teams close the books monthly. Operators make decisions weekly. If the most current cost data you have is from last month's close, you are making this week's channel allocation, pricing, and budget decisions with information that is already 2–5 weeks stale.
In businesses with meaningful seasonality, active campaign testing, or competitive pressure, month-old cost data is not just incomplete — it is actively misleading. A channel that was margin-positive last month may have deteriorated this month due to rising CAC or increasing returns. The operator who acts on stale data makes decisions based on a reality that no longer exists. Margin intelligence updates on a weekly or daily cadence, so the decision and the data are synchronized.
Sign 3: You Cannot Answer Which Channel Drives the Most Profitable Customers
This is the diagnostic question that separates businesses with margin intelligence from those without. If you cannot answer it within 60 seconds — with data, not intuition — your margin visibility is insufficient for operating decisions.
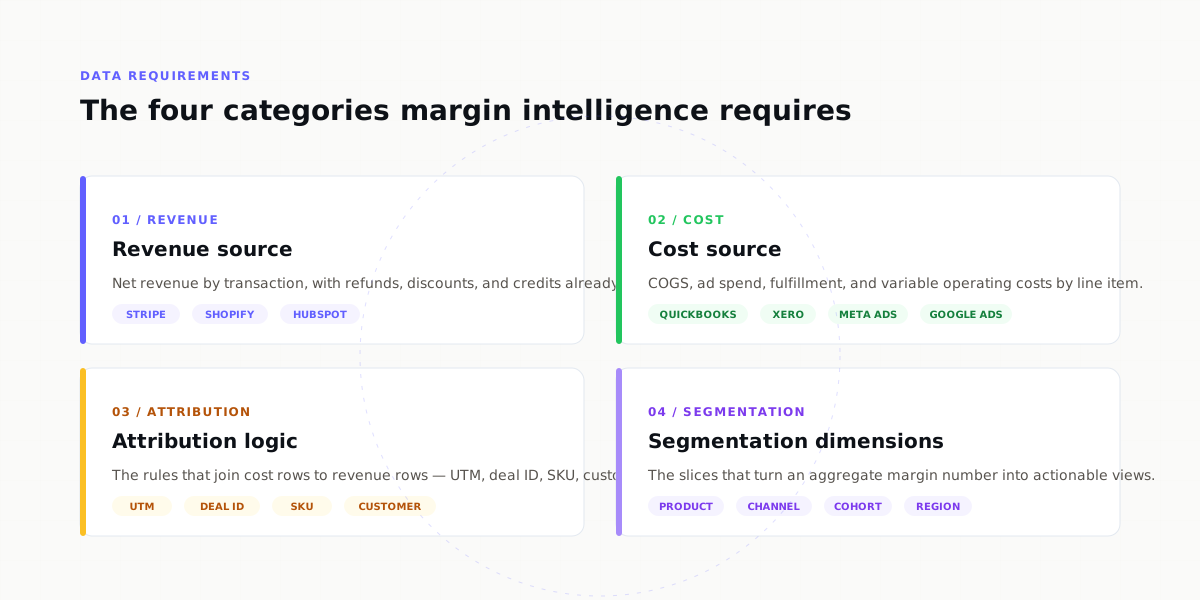
The answer requires connecting revenue data (from your payment processor or e-commerce platform) to cost data (from your accounting tool) to attribution data (from your ad platforms and CRM) — all segmented by channel. Most operators have these data sources. Few have them connected into a shared margin view. The result is that channel allocation decisions are made on ROAS, revenue, or intuition — none of which reliably predict profitability. For more on building this view, see our post on contribution margin by channel.
How Fairview Tracks Margin Intelligence
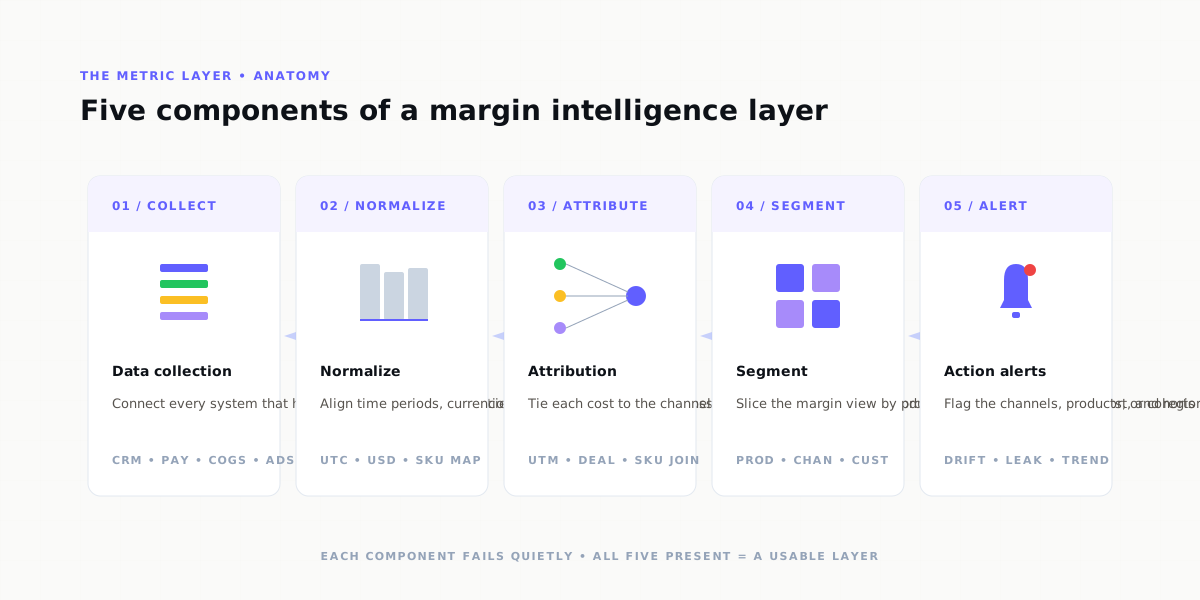
Fairview's Margin Intelligence feature is designed for operators who need a working margin view without building a data warehouse or hiring a data team. It connects to the tools you already use, normalizes the data across them, and surfaces contribution margin by channel, product line, and customer segment.
Here is how it works in practice:
- Connect your sources. Fairview connects to QuickBooks or Xero for cost data, Stripe for revenue data, Shopify for order and product data, and Google Ads and Meta Ads for spend data. The first integration is live in under 10 minutes. Each additional source adds to the margin layer without engineering support.
- Normalize across systems. Fairview reconciles the different definitions of revenue, cost, and date conventions across your tools. A Stripe payment, a QuickBooks expense line, and a Shopify order are joined into a shared schema so comparisons are valid — not just technically possible but semantically broken.
- Apply attribution logic. Fairview allocates ad spend to the revenue it produced using your chosen attribution model. The result is channel-specific contribution margin — not aggregate revenue minus aggregate spend, but revenue from Channel A minus the spend that drove Channel A.
- Surface margin by dimension. The Operating Dashboard shows margin by channel, by SKU, by campaign, and by customer segment. You see which dimensions are above trend, which are deteriorating, and which are outside expected ranges — all in one screen.
- Flag anomalies and recommend actions. The Next-Best Action Engine detects margin drops, pipeline stalls, and churn risk signals — then generates specific recommendations. "Margin on paid search dropped 18% this week. Review Google Ads spend by campaign." Actions appear in the dashboard and can be assigned to a team member with a deadline.
The key outcome: companies using Fairview's Margin Intelligence recover an average of 23% of leaking margin in the first 90 days. The feature requires a finance integration (QuickBooks, Xero, or Stripe) to calculate the cost side of the margin equation. Without it, Fairview shows revenue and pipeline — not full margin.
Margin Intelligence is available on the Growth plan and above. To see how it works with your specific source stack, book a demo or explore Fairview to learn more about the full feature set.
How is margin intelligence different from gross margin?
Gross margin is a single number: revenue minus direct costs, reported for the whole business over a period. Margin intelligence is a layered, segmented view that breaks profit down by channel, SKU, and customer segment — and updates frequently enough to guide operating decisions. Gross margin answers "were we profitable?" Margin intelligence answers "which channel is eroding profit this week, and what should we do about it?"
Why does blended margin mislead operators?
Blended margin averages all channels and products into one number. A channel running at negative contribution margin can be hidden inside a healthy-looking aggregate. The operator sees 45% blended margin and thinks the business is fine, while one channel is losing money on every sale. Margin intelligence surfaces the variance that blended margin conceals.
What are the four layers of margin intelligence?
The four layers are: (1) Gross margin — revenue minus direct COGS; (2) Contribution margin — gross margin minus variable costs like ad spend and fulfillment, by channel; (3) Net margin — contribution margin minus fixed and operating costs; and (4) Channel margin — profit broken down by SKU, acquisition channel, and customer segment. Each layer adds granularity that the previous layer hides.
Do I need a data team to implement margin intelligence?
No. Purpose-built tools can connect your existing accounting, payment, CRM, and ad platforms without engineering support. The limiting factor is data quality — chart-of-accounts alignment and UTM consistency — not technical complexity. Most operators at 50–300 employees can build a working margin view within 1–2 weeks.
How does Fairview track margin intelligence?
Fairview connects to your CRM, accounting tool, payment processor, and ad platforms via native integrations. It normalizes data across systems, applies attribution logic to allocate ad spend by channel, and surfaces contribution margin by channel, product line, and customer segment in the Operating Dashboard. The Margin Intelligence module flags anomalies and recommends specific actions through the Next-Best Action Engine.
What is the difference between margin intelligence and profit analytics?
Profit analytics is typically retrospective and aggregate — it answers "what was our profit last quarter?" Margin intelligence is continuous and segmented — it answers "which channel is margin-positive right now, and where is profit leaking?" The difference is cadence, granularity, and actionability. Profit analytics reports; margin intelligence operates.
Key Takeaways
- Margin intelligence is not margin reporting. Reporting tells you what happened. Intelligence tells you what is changing, where, and what to do about it — on a cadence that matches your operating rhythm.
- The four layers matter independently. Gross margin, contribution margin, net margin, and channel margin each reveal costs the previous layer hides. Most operators track one layer and miss the other three.
- Blended margin is a liability for operators. It is accurate for board reporting and dangerously misleading for channel allocation. The segmented view is where the decision-relevant signal lives.
- Three signs say you need margin intelligence: optimizing for revenue without profit visibility, making weekly decisions with month-old cost data, and inability to name your most profitable channel.
- You do not need a data team to start. Purpose-built tools connect your existing sources and produce a working margin view within 1–2 weeks. The barrier is data quality, not technical complexity.