TL;DR
- The subscription model is a math problem: Churn, LTV, and CAC interact in ways that compound over time. A 5% monthly churn rate cuts customer lifetime in half compared to 3%. Small differences in these metrics create large differences in outcomes.
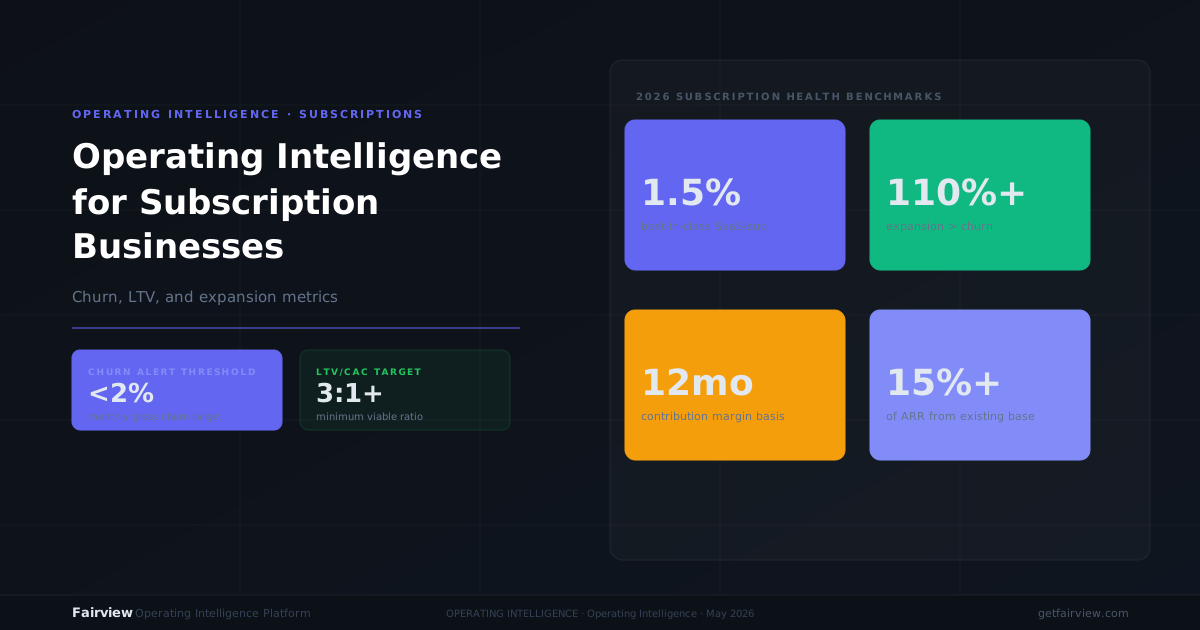
- Churn benchmarks vary by segment: Enterprise SaaS targets below 1% monthly. Mid-market B2B aims for 1-2%. SMB and B2C subscriptions run 3-10%. The trend matters more than the absolute number.
- LTV:CAC ratio is the profitability signal: The 3:1 rule is now the floor, not the target. Top-quartile B2B SaaS companies hit 4:1 to 5:1. The ratio must be calculated with gross-margin-adjusted LTV, not revenue.
- Net revenue retention separates growers from stallers: NRR above 100% means your existing customer base generates more revenue this year than last. Top-quartile SaaS posts 115% or higher.
- Operating intelligence closes the gap: Connecting CRM, payment, and finance data into one monitored view lets operators catch churn signals early, spot expansion opportunities, and act before the quarterly review.
The subscription business model lives or dies by three numbers: how fast customers leave, how much they are worth while they stay, and how much it costs to bring them in. Every other metric — ARR, MRR, burn rate, valuation — is downstream of these three. Yet most subscription operators still assemble these numbers from three different tools on Monday morning. By the time the spreadsheet is ready, the decision window has closed.
This post is a field guide to the metrics that matter for subscription businesses. Not every metric. The ones that determine whether your model is sustainable, whether your growth is profitable, and whether you are building a business or burning capital. We cover the formulas, the 2026 benchmarks, the common calculation errors, and the operating rhythm that turns these numbers into decisions. By the end, you will know what to track, how to calculate it, and what to do when the number moves.
Churn: The Metric That Compounds Against You
Churn is the rate at which customers stop paying you. It is the single most consequential metric in a subscription business because it operates in reverse compound interest. A 5% monthly churn rate means you lose nearly half your customer base every year. A 2% monthly churn rate means you lose less than a quarter. The difference between these two numbers is not 3 percentage points. It is the difference between a business that can grow profitably and one that cannot.
There are two types of churn, and confusing them is a common operator error. Logo churn measures the percentage of customers who cancel. Revenue churn measures the percentage of recurring revenue that disappears. A business can have low logo churn but high revenue churn if its largest accounts are leaving. A business can have high logo churn but low revenue churn if it loses small customers while its enterprise accounts expand. Both numbers matter. Revenue churn is the one that hits your P&L.
The formulas are straightforward:
Logo churn rate: Customers lost in period divided by customers at start of period.
Revenue churn rate: MRR lost in period divided by MRR at start of period.
Net revenue retention: Starting MRR plus expansion minus contraction and churn, divided by starting MRR. This is the metric that tells you whether your existing customer base is growing or shrinking in value.
Benchmarks for 2026 vary dramatically by segment. According to industry data compiled across SaaS benchmark reports, enterprise SaaS with annual contracts and high switching costs should target below 1% monthly churn, or 5-10% annually. Mid-market B2B SaaS should aim for 1-2% monthly. SMB SaaS typically sees 3-5% monthly, which is acceptable if the acquisition cost is low and the payback period is under 12 months. B2C subscriptions, mobile apps, and subscription boxes run higher — 5-12% monthly — and must compensate with lower CAC and faster payback.
The most important benchmark is not an industry average. It is your own trend. A company reducing churn from 8% to 5% is in a healthier position than one flat at 4%. The direction of the line matters more than its starting point.
One often overlooked source of churn is involuntary cancellation — payment failures, expired cards, and billing issues. Industry research indicates that approximately 68% of subscription churn is involuntary, driven by failed payments rather than active cancellation decisions. This is the easiest churn to fix. Dunning campaigns, payment retry logic, and proactive billing notifications can recover a meaningful share of this lost revenue without changing the product.
Customer Lifetime Value: The Revenue You Capture Per Customer
Customer lifetime value answers a simple question: how much gross profit does one customer generate before they leave? The answer determines how much you can spend to acquire that customer, how fast you recover that spend, and whether your unit economics work at all.
The standard formula for subscription LTV is:
LTV equals ARPU multiplied by gross margin percentage, divided by monthly churn rate.
For example, a customer paying $100 per month with an 80% gross margin and a 5% monthly churn rate has an LTV of $1,600. The same customer with a 2% monthly churn rate has an LTV of $4,000. The churn rate change alone triples the value of every customer you acquire. This is why churn reduction is the highest-ROI activity in most subscription businesses.
The most common LTV calculation error is using revenue instead of gross margin. Revenue LTV is a vanity number. Gross margin LTV is the number that matters for CAC decisions. If your gross margin is 70%, every dollar of revenue LTV overstates true customer value by 30%. Always use gross margin in the numerator.
Another common error is using a static churn rate. Churn changes by cohort, by segment, and by time in product. Month-1 churn for a new customer is typically 2-3x higher than Month-6 churn. Customers who survive the first 90 days often have significantly lower long-term churn. The most accurate LTV calculation uses cohort-specific churn curves, not a single blended rate. For operators without cohort data, a reasonable shortcut is to use the 6-month trailing churn rate rather than the all-time average.
LTV benchmarks by segment in 2026 show wide variation. Enterprise SaaS with ACV above $100,000 posts median LTV of $187,500. Mid-market SaaS at $25,000-$100,000 ACV hits $43,200 median. SMB SaaS at $5,000-$25,000 ACV sits at $18,400. These numbers are directional, not prescriptive. Your LTV depends on your pricing, your margin structure, and your retention performance.
For a deeper look at how to calculate and improve the ratio that governs acquisition spend, see our guide on LTV:CAC ratio benchmarks.
CAC and CAC Payback: The Cost Side of the Equation
Customer acquisition cost is the fully loaded spend to win one new customer. It includes every dollar of sales and marketing expense — salaries, commissions, ad spend, tools, events — allocated to new customer acquisition. Not expansion. Not retention. New customers only.
The formula is:
CAC: Total sales and marketing spend in period divided by new customers acquired in the same period.
The payback period is how many months of gross margin it takes to recover that acquisition cost:
CAC payback: CAC divided by monthly gross margin per customer.
A payback period under 12 months is the standard healthy target for B2B SaaS. Under 8 months is best-in-class. Over 18 months is a warning signal, especially if your cash runway is limited. A long payback period means you are funding growth with capital, not with the margin from existing customers.
CAC has risen across the subscription industry. The average B2B customer journey now involves over 70 touches across multiple channels before conversion. Sales and marketing spend as a percentage of new ARR has increased, stretching payback periods. This makes the LTV:CAC ratio more important than ever. If CAC is rising and LTV is flat, the business model is deteriorating even if top-line ARR looks healthy.
The LTV:CAC ratio combines both sides of the equation:
LTV:CAC ratio: Gross-margin-adjusted LTV divided by fully loaded CAC.
The classic 3:1 rule — three dollars of lifetime value for every dollar of acquisition cost — is now the floor, not the target. According to 2025 benchmark data, the median LTV:CAC for private B2B SaaS hit 3.6:1, and top-quartile companies push 4:1 to 5:1. Below 3:1 means your acquisition is barely profitable or unprofitable when fully loaded costs are included. Above 5:1 may mean you are under-investing in growth and leaving revenue on the table.
For a detailed breakdown of payback benchmarks by stage and industry, see our guide on CAC payback period benchmarks.
Net Revenue Retention: The Growth Metric Hidden in Your Existing Base
Net revenue retention is the most underappreciated metric in subscription businesses. It measures whether your existing customers generate more revenue this year than last, after accounting for churn, downgrades, and upgrades. An NRR of 110% means that $100 of MRR from last year became $110 this year, without acquiring a single new customer.
This metric separates subscription businesses that grow sustainably from those that run on a treadmill of constant new acquisition. A business with 110% NRR can grow even if it acquires no new customers. A business with 95% NRR must acquire new customers faster than it loses existing revenue just to stand still.
NRR benchmarks for 2026 show clear segmentation. Enterprise SaaS posts a median NRR of 118%, with top-quartile companies at 138%. Mid-market B2B SaaS hits 116% median. PLG and usage-based models lead at 121% median, driven by natural expansion as customers consume more. SMB SaaS lags at 104% median, where expansion revenue is harder to capture and churn is higher.
The drivers of NRR are threefold. First, gross revenue retention — the percentage of revenue retained before expansion. Strong GRR means your customers stay and maintain their spend. Second, expansion revenue from upsells, cross-sells, and usage increases. Third, contraction from downgrades and seat reductions. The operator's job is to monitor all three drivers separately, not just the blended NRR number.
Usage-based billing models have emerged as a structural advantage for NRR. Companies with usage-based pricing post NRR 10% higher than fixed-subscription peers, driven by natural expansion as customers grow. This does not mean every subscription business should switch to usage-based pricing. It does mean that operators should examine whether their pricing model creates natural expansion pathways or forces customers into binary upgrade decisions.
The Subscription Metrics Dashboard: What to Track Weekly
Knowing the metrics is not the same as tracking them consistently. Most subscription operators have the numbers somewhere. They are in Stripe, in HubSpot, in a spreadsheet that someone updates on Fridays. The problem is not data availability. It is data assembly. By the time the numbers are in one place, the week is over and the opportunity to act has passed.
The weekly subscription metrics dashboard should contain seven numbers. No more. These are the numbers that change week to week and drive decisions.
| Metric | Source | Decision Trigger |
|---|---|---|
| New MRR | Stripe / payment processor | Decline for 2+ weeks = review acquisition channels |
| Churned MRR | Stripe / payment processor | Spike above trailing average = investigate cancellations |
| Net MRR growth | New MRR minus churned MRR | Below target = reallocate acquisition or retention spend |
| LTV:CAC ratio | Finance + CRM data | Below 3:1 = pause acquisition, fix unit economics |
| CAC payback | Sales and marketing spend / new customers | Above 12 months = review channel mix and pricing |
| NRR (trailing 12 months) | Starting MRR + expansion - churn / starting MRR | Below 100% = focus on retention before acquisition |
| Pipeline coverage | CRM | Below 3× = flag risk to next quarter's new MRR |
The key is not the dashboard itself. It is the operating rhythm around it. The same seven numbers, reviewed every Monday, by the same people, with a decision framework for when each number moves. Without the rhythm, the dashboard is decoration. With the rhythm, it is a decision engine.
For a complete template for structuring this weekly review, see our guide on weekly revenue review template and agenda.
Common Calculation Errors That Mislead Operators
Even experienced operators make errors when calculating subscription metrics. These errors are dangerous because they produce numbers that look reasonable but lead to bad decisions. Here are the five most common.
Error 1: Using revenue instead of gross margin in LTV
This is the most common and most costly error. Revenue LTV overstates true customer value by the amount of cost to serve. A business with 60% gross margin and $10,000 revenue LTV has only $6,000 of gross margin LTV. If CAC is $3,000, the revenue-based ratio looks like 3.3:1. The margin-based ratio is 2:1 — below the sustainability threshold. Always use gross margin.
Error 2: Blending new and expansion CAC
Expansion revenue costs less than new customer acquisition. Blending the two understates true new customer CAC and overstates the efficiency of your acquisition engine. Track new CAC and expansion CAC separately. The LTV:CAC ratio should use new CAC in the denominator, not a blended number.
Error 3: Using point-in-time churn instead of cohort curves
A single monthly churn rate hides the fact that Month-1 churn is typically 2-3x higher than Month-6 churn. Using the blended rate understates LTV for long-tenured customers and overstates it for new cohorts. Build cohort curves by acquisition month. Use the 6-month trailing rate as a practical shortcut if cohort data is not yet available.
Error 4: Ignoring involuntary churn in the headline number
When you report churn to the board or the team, separate voluntary and involuntary churn. A 5% monthly churn rate that is 80% involuntary is a billing problem, not a product problem. The fix is dunning and payment retry, not roadmap changes. Mixing the two categories leads to solving the wrong problem.
Error 5: Tracking NRR annually but acting monthly
NRR is a lagging indicator. By the time your trailing-12-month NRR drops below 100%, the damage has been happening for months. Track the components monthly: gross retention, expansion rate, and contraction rate. These leading indicators let you act before NRR moves.
How Fairview Tracks Subscription Metrics
This post has focused on the metrics themselves. It is worth being explicit about how an operating intelligence platform handles the tracking, monitoring, and action layer for subscription businesses.
Fairview connects to the systems subscription businesses already use: Stripe for payment and MRR data, HubSpot or Salesforce for pipeline and customer records, and QuickBooks or Xero for cost data. The Data Connection Layer normalizes data across sources, handles duplicate records, and refreshes on a configurable cadence. The first integration goes live in under 10 minutes.
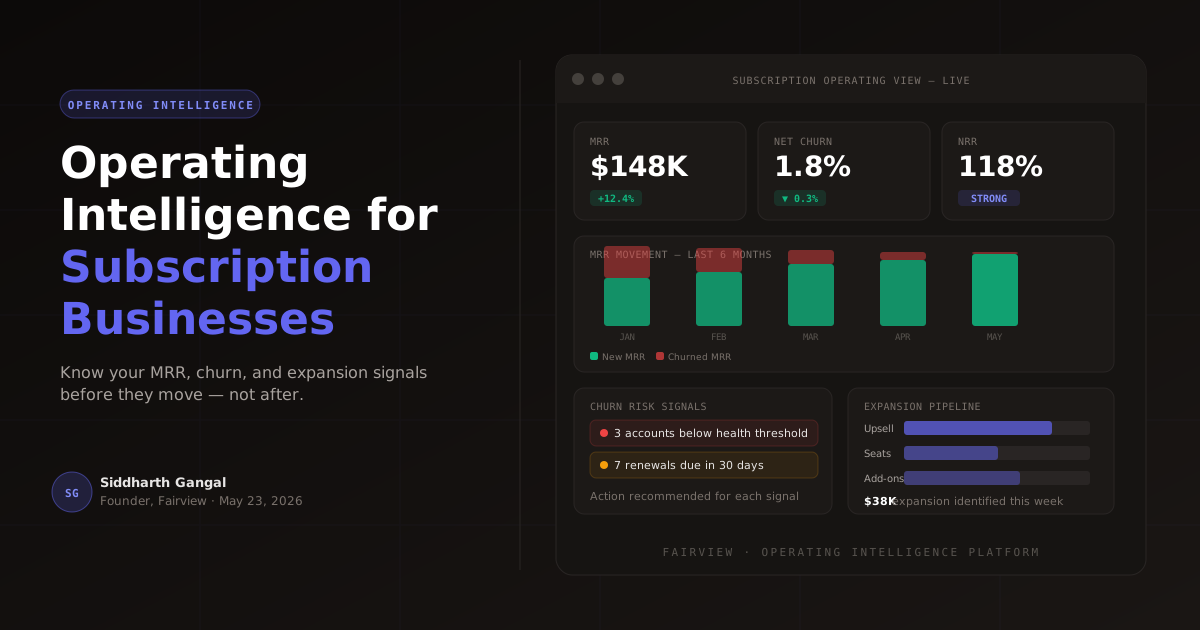
The Operating Dashboard surfaces the subscription metrics that matter: MRR growth, churn rate, LTV:CAC ratio, and NRR — updated in real time as connected sources refresh. It flags changes from the prior period automatically. No manual comparison required.
The Margin Intelligence layer pulls revenue data from Stripe and cost data from accounting tools to calculate true contribution margin by customer segment, channel, and cohort. This is the gross margin number that feeds into accurate LTV calculations. Companies using this feature recover an average of 23% of leaking margin in the first 90 days.
The Pipeline Health Monitor tracks deal progression for new subscription sales and surfaces risk signals before deals fall through. For subscription businesses with sales-led acquisition, this is the early warning system for next month's new MRR.
The Forecast Confidence Engine generates a weekly revenue forecast based on pipeline stage, historical close rates, and deal velocity. It assigns a confidence score and shows an optimistic-to-conservative range. For subscription operators who need to know whether they will hit the number before the quarter ends, this replaces spreadsheet guesswork with data-driven projection.
The Next-Best Action Engine is the layer that separates Fairview from passive dashboards. When Fairview detects an anomaly — a spike in churn from a specific cohort, a drop in expansion revenue, a CAC payback period stretching beyond target — it generates a specific, named recommendation. Not an alert. An action.
Examples of actions Fairview triggers for subscription businesses:
- "Churn from the March cohort spiked to 8% this week. Review onboarding sequence for that cohort."
- "Expansion MRR from enterprise accounts dropped 15% vs. prior month. Check account health scores in Salesforce."
- "CAC payback on paid social stretched to 14 months. Review Meta Ads spend by campaign and compare to LTV by channel."
The Weekly Operating Report summarizes the prior week: MRR movement, churn and expansion trends, LTV:CAC ratio, and open action items. Operators arrive at their Monday review already briefed, not building.
For a broader view of how operating intelligence differs from traditional business intelligence, see our guide on operating intelligence vs business intelligence.
Key Takeaways
- Churn is the metric that compounds against you. A 5% monthly churn rate cuts customer lifetime in half compared to 3%. Track both logo churn and revenue churn separately.
- LTV must be calculated with gross margin, not revenue. The most common operator error overstates customer value by 20-40% and leads to unsustainable acquisition spend.
- The 3:1 LTV:CAC ratio is the floor, not the target. Top-quartile B2B SaaS companies hit 4:1 to 5:1. Below 3:1 means your acquisition is barely profitable.
- Net revenue retention separates growers from stallers. NRR above 100% means you grow without acquiring new customers. Top-quartile SaaS posts 115% or higher.
- CAC payback under 12 months is the healthy target. Over 18 months is a warning signal, especially with limited cash runway.
- Track seven metrics weekly: new MRR, churned MRR, net MRR growth, LTV:CAC, CAC payback, NRR, and pipeline coverage. The rhythm matters more than the dashboard.
- Separate voluntary and involuntary churn in your reporting. Approximately 68% of subscription churn is involuntary — a billing problem, not a product problem.
If you are running a subscription business and spending Monday mornings assembling metrics from Stripe, HubSpot, and spreadsheets, book a demo to see how Fairview connects your data into one operating view — and surfaces the specific action alongside every insight.
How do you calculate customer lifetime value for a subscription business?
The standard formula is: LTV equals ARPU multiplied by gross margin percentage, divided by monthly churn rate. For example, a customer paying $100 per month with an 80% gross margin and a 5% monthly churn rate has an LTV of $1,600. A more conservative approach uses gross margin adjusted LTV divided by full CAC to get the LTV:CAC ratio. The key is to use gross margin, not revenue, and to update the churn rate monthly as your cohort data improves.
What is a good churn rate for a SaaS subscription business?
It depends on your segment. Enterprise SaaS with annual contracts should target below 1% monthly or 5% annually. Mid-market B2B SaaS should aim for 1-2% monthly. SMB SaaS typically sees 3-5% monthly, which is acceptable if CAC is low and payback is under 12 months. B2C subscriptions and mobile apps often run 5-10% monthly. The benchmark that matters most is your own trend: a business reducing churn from 8% to 5% is healthier than one flat at 4%.
What is net revenue retention and why does it matter for subscriptions?
Net revenue retention measures whether your existing customer base grows or shrinks in revenue over a period, typically 12 months. The formula is: starting MRR plus expansion revenue minus contraction and churn, divided by starting MRR. An NRR above 100% means existing customers generate more revenue this year than last, even after accounting for churn. This matters because it determines whether your business can grow without acquiring a single new customer. Top-quartile SaaS companies post NRR of 115% or higher.
How does operating intelligence help subscription businesses?
Operating intelligence connects your CRM, payment processor, and finance tools into one view, then monitors the metrics that matter continuously. For subscription businesses, this means catching churn signals before cancellation, spotting expansion revenue opportunities in usage data, and flagging CAC payback drift before it becomes a cash problem. Instead of assembling reports on Monday morning, the operator receives a pre-built weekly briefing with specific actions: which accounts to check, which campaigns to review, which cohorts are at risk.