TL;DR
- What it is: LTV:CAC ratio measures whether the lifetime value of a customer justifies the cost to acquire them. It is contribution-margin LTV divided by fully loaded CAC.
- SaaS benchmarks: 3:1 is healthy for SMB, 3.5:1 for mid-market, 4:1 for enterprise. Below 2:1 requires immediate review.
- Ecommerce benchmarks: 2.5:1 to 3:1 on a 24-month horizon for subscription and consumables. One-time purchase brands rarely clear 2:1.
- The 3:1 trap: A good ratio with a 24-month payback burns cash. Always pair LTV:CAC with CAC payback period.
- Measurement honesty: Cap LTV at 24 to 36 months, use contribution margin (not gross), and include all acquisition costs — not just ad spend.
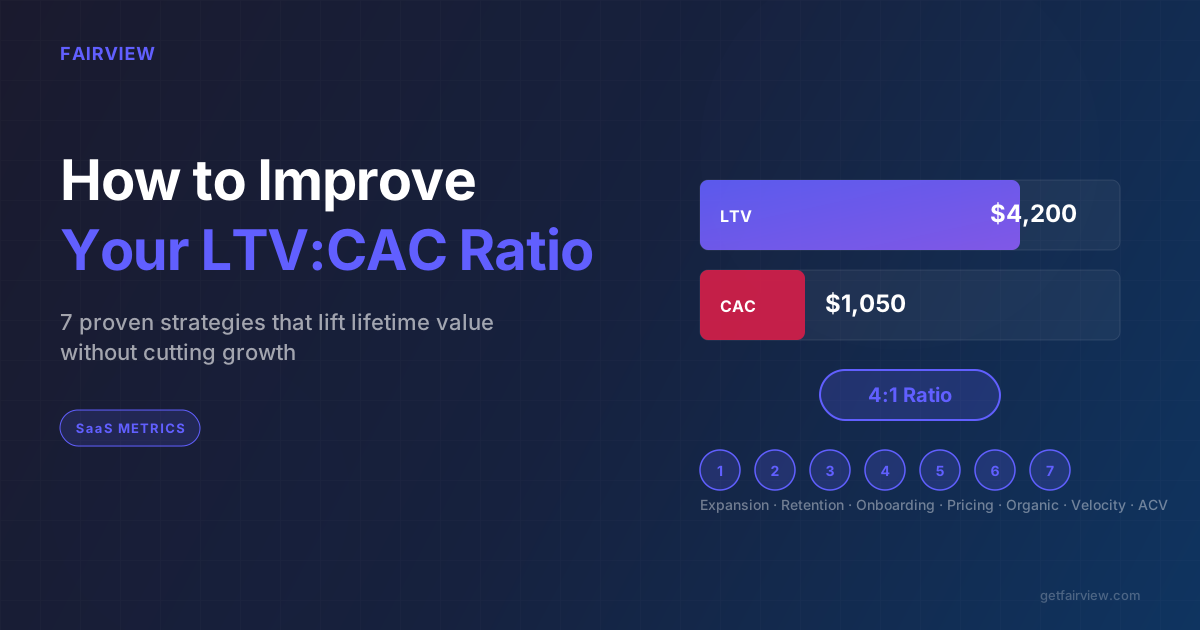
A 3:1 LTV:CAC ratio is the number most operators memorize. Fewer can explain how they calculated it, fewer still can defend it in a board meeting, and almost nobody measures it per channel where the real story lives. This post gives you the complete framework: three ways to calculate LTV, the fully loaded CAC formula most teams get wrong, benchmarks by business model and stage, and the five levers that actually move the number.
The ratio is simple in theory and difficult in practice. The theory: divide what a customer is worth by what you paid to acquire them. If the result is above a threshold, your unit economics work. The practice: defining "worth" requires choosing a margin layer, a time horizon, and a cohort. Defining "paid" requires deciding whether to include salaries, tooling, content production, and agency fees. Most teams optimize for the slide, not the truth.
This guide is structured to take you from definition to action. It covers the formula, three LTV calculation methods, the fully loaded CAC breakdown, benchmarks for SaaS and ecommerce, five ways to improve the ratio, when a low ratio is acceptable, and how Fairview tracks it automatically. It is a companion to our posts on CAC payback period, D2C unit economics, and retention metrics.
Definition
LTV:CAC ratio is the contribution-margin lifetime value of a customer divided by the fully loaded cost to acquire them. It measures whether customer economics justify the cost of growth. Higher is better, to a point — above 5:1 usually signals underinvestment in acquisition rather than strength.
What Is the LTV:CAC Ratio?

The LTV:CAC ratio compresses three business dynamics into a single number: how much a customer pays over time, how long they stay, and how efficiently you acquire them. That compression makes it useful for high-level decisions and dangerous for operational ones. A 3:1 ratio can hide a 24-month payback, a 40% gross-to-contribution gap, or a cohort where half the customers churn in the first 90 days.
Investors use LTV:CAC as shorthand for capital efficiency. Operators should use it as one number in a dashboard of four: the ratio itself, CAC payback period, gross retention, and net revenue retention (for SaaS) or repeat purchase rate (for ecommerce). No single number tells the full story.
The core formula is straightforward:
The complexity lives in the definitions. "Contribution-margin LTV" is not the same as "gross revenue LTV." "Fully loaded CAC" is not the same as "paid ad spend." The rest of this post unpacks each term so you can calculate a number that survives scrutiny.
Worked example — SaaS. A SMB SaaS tool at $89 per month. Gross margin is 78%, but variable support and payment fees pull contribution margin to 70%. Contribution margin per customer per month: $62. Gross churn is 2.5% per month, expansion is 1%. Over 24 months, contribution LTV equals $1,740. Blended CAC across paid, content, and outbound channels: $540. Ratio equals 3.2:1. Healthy.
Worked example — ecommerce. A D2C coffee brand. Average order value is $46, contribution margin is 36% = $16.50 per order. Repeat rate is 55%, with an average of 3.1 orders per customer in 24 months. LTV equals $51 per customer. Blended CAC is $22. Ratio equals 2.3:1. Acceptable for coffee; weak for apparel.
Key insight
Always cap LTV at a fixed horizon — 24 months for ecommerce, 36 months for SaaS. An infinite-horizon LTV assumes customers live forever. They do not.
How to Calculate LTV (3 Methods)
There are three common ways to calculate lifetime value. Each makes different assumptions, suits different business models, and produces different numbers. Understanding which method you are using — and why — is the first step to an honest ratio.
Method 1: The Simple Formula (SaaS)
The most common SaaS method uses average revenue per user, gross margin, and monthly churn:
For a company with $100 ARPU, 80% gross margin, and 2% monthly churn: LTV = $100 × 0.80 ÷ 0.02 = $4,000. This method is fast and requires only three inputs. The limitation: it assumes churn is constant, ignores expansion revenue, and produces an infinite-horizon number that overstates reality. Cap the result at 36 months for planning purposes.
Method 2: Cohort-Based LTV (Ecommerce and SaaS)
The cohort method is the most honest approach. It tracks actual customers who signed up in a given month and measures their cumulative contribution margin over time. No assumptions about future behavior — just observed data.
The process: group customers by acquisition month, track their revenue and costs month by month, and sum the contribution margin until the cohort matures or reaches your horizon cap. The result is a curve, not a single number. You can see exactly when the cohort turns profitable and whether newer cohorts are improving or degrading.
For ecommerce, cohort-based LTV is essential because repeat purchase behavior varies dramatically by acquisition channel, season, and promotion type. A customer acquired during Black Friday behaves differently from one acquired in March. Blending them into a single LTV number hides that reality.
Method 3: Historical Average (Quick Estimate)
The historical average method is the fastest and least precise. It takes total revenue from a period, divides by total customers acquired in that period, and multiplies by an assumed lifespan:
This method works for early-stage companies without enough cohort history. The risk: it assumes all customers are identical and that historical averages predict future behavior. Use it only when you lack cohort data, and replace it with Method 2 as soon as you have 12 months of history.
Which method to use
SaaS with 24+ months of data: Method 2 (cohort-based). SaaS under 24 months: Method 1 with a 36-month cap. Ecommerce: Method 2 always — repeat behavior is too variable for formulas. Early-stage, any model: Method 3 as a placeholder, with a plan to graduate to cohorts.
How to Calculate CAC (Fully Loaded)
Most teams understate CAC by 40 to 80%. The reason: they count only direct ad spend and ignore the full cost of acquiring customers. A fully loaded CAC includes every dollar spent to get a new customer through the door, not just the dollars spent on the ad platform.
The fully loaded CAC formula:
Here is what belongs in each bucket:
- Ad spend: All paid acquisition — Google Ads, Meta Ads, LinkedIn, programmatic, affiliate commissions, and influencer fees. This is the number most teams start and stop with.
- Salaries: The portion of marketing and sales team salaries attributable to new customer acquisition. For a 5-person growth team, if 60% of their time goes to acquisition (vs. retention or brand), allocate 60% of salary cost to CAC.
- Agency fees: Any external agency managing paid media, SEO, or creative production. Include management fees, not just ad spend.
- Tooling: Marketing automation, attribution software, CRM seats used by the growth team, design tools, and analytics platforms. Annual contracts should be amortized monthly.
- Content production: Blog writing, video production, podcast editing, and creative asset development specifically for acquisition. Exclude brand content not tied to conversion.
- Events and partnerships: Trade show booths, webinar platforms, co-marketing costs, and referral program incentives.
Common mistake: paid-only CAC. A team reports CAC of $180 based on Meta and Google spend alone. The fully loaded number, including salaries, agency fees, and tooling, is $340. The LTV:CAC ratio drops from 3.2:1 to 1.7:1. The business model changes from healthy to questionable — but only if you measure honestly.
Time period alignment. CAC and LTV must use the same time period. If you calculate LTV over 24 months, CAC should reflect acquisition costs from the same cohort period. A common error: measuring CAC from this quarter's spend against LTV from customers acquired two years ago. The acquisition environment changes. The numbers must match.
SaaS LTV:CAC Benchmarks by Stage
SaaS benchmarks vary by customer segment, deal size, and sales motion. A PLG self-serve tool has different economics from an enterprise sales-led product. The table below separates benchmarks by segment so you can compare against the right standard.
| SaaS Segment | Healthy | Best-in-class | Review Below |
|---|---|---|---|
| SMB SaaS | 3:1 | 4:1+ | < 2:1 |
| Mid-market SaaS | 3.5:1 | 5:1+ | < 2.5:1 |
| Enterprise SaaS | 4:1 | 6:1+ | < 3:1 |
| PLG / Self-serve | 3:1 | 5:1+ | < 2:1 |
SMB SaaS lives or dies by the 3:1 ratio. The segment has lower sales costs but higher churn, so the economics must work on a shorter timeline. Mid-market and enterprise carry higher sales and implementation costs, so the ratio has to stretch to justify the acquisition window. Investors reviewing Series B and later SaaS rounds typically want 4:1 or better with net revenue retention above 110%.
The OpenView 2024 SaaS benchmark report puts median LTV:CAC for growth-stage SaaS at 2.8:1, with top-quartile companies at 4.6:1. The benchmark has tightened in the last three years as capital has become more expensive and investors demand faster payback.
Ecommerce LTV:CAC Benchmarks by Category
Ecommerce benchmarks are lower than SaaS because repeat behavior is harder to guarantee and contribution margins are tighter. A 2.5:1 ratio with 55% repeat rate and a six-month first-order payback is a healthier business than a 4:1 ratio built on projected ten-year retention that has never been observed.
| Ecommerce Model | Healthy | Best-in-class | Review Below |
|---|---|---|---|
| D2C Subscription | 3:1 | 4:1+ | < 2:1 |
| Consumables (coffee, beauty) | 2.5:1 | 3.5:1+ | < 1.8:1 |
| Apparel / Fashion | 2.5:1 | 3:1+ | < 1.5:1 |
| Home goods / One-time | 2:1 | 2.5:1+ | < 1.2:1 |
| Marketplace (commission) | 3:1 | 5:1+ | < 2:1 |
The 2.5:1 floor for consumables comes from structural margin compression. Average order values are typically $30 to $80, with shipping and COGS eating 55 to 70% of revenue before variable marketing gets allocated. Coffee and beauty brands that build subscription mechanics can push toward 3.5:1 by improving repeat rate from 55% to 70%.
Apparel is the hardest category for LTV:CAC because return rates are high (20 to 40% for online fashion), seasonality drives inconsistent repurchase, and customer taste shifts quickly. A 2.5:1 ratio in apparel is equivalent to a 3.5:1 ratio in consumables because of the higher operational volatility.
5 Ways to Improve Your LTV:CAC Ratio
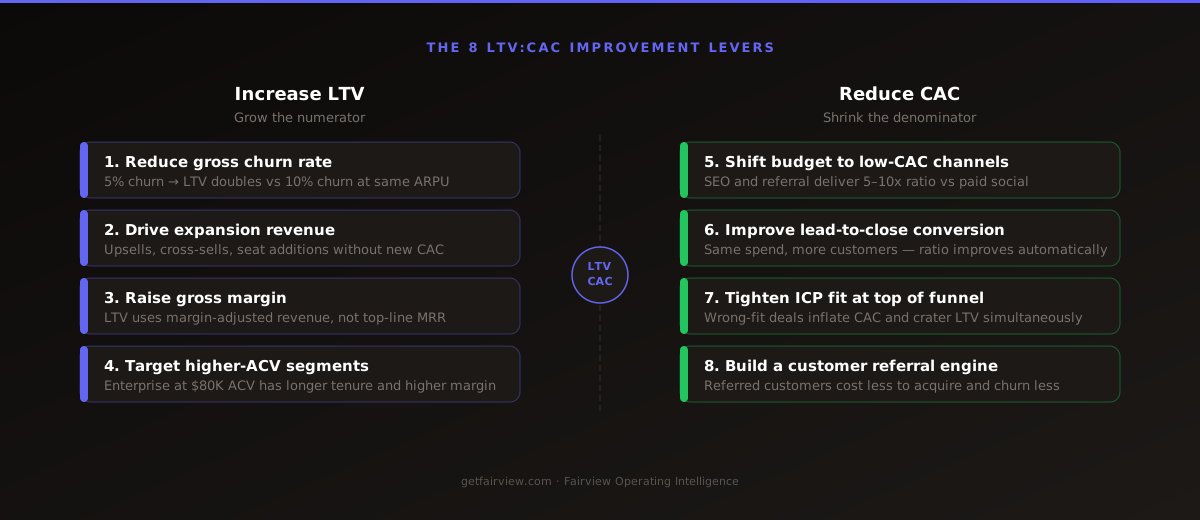
Improving the ratio requires moving one side of the fraction, the other, or both. The five levers below are ordered by impact and speed. Most operators over-index on acquisition cost reduction and under-invest in lifetime value expansion.
1. Increase Contribution Margin (Fastest Impact)
Raising contribution margin has a linear effect on LTV. A 10-point improvement in contribution margin (from 30% to 40%) increases LTV by 33% without acquiring a single new customer or improving retention. The levers: reduce COGS through supplier negotiation, cut shipping costs via carrier renegotiation, reduce return rates with better sizing guides or product descriptions, and eliminate discounting that trains customers to wait for sales.
2. Improve Retention and Repeat Rate
For ecommerce, moving repeat rate from 40% to 55% increases LTV by 37% (assuming constant order frequency). The levers: post-purchase email sequences, subscription offers, loyalty programs, and product bundling that increases basket size per visit. For SaaS, reducing monthly churn from 3% to 2% extends average customer lifespan by 50%. The levers: onboarding optimization, proactive health scoring, and expansion revenue through upsells and cross-sells.
3. Optimize CAC by Channel
Blended CAC hides enormous variation. One channel may deliver customers at $120 CAC with 4:1 LTV:CAC. Another may cost $400 with 1.2:1. The fix: measure CAC and LTV per channel, per campaign, and per cohort. Reallocate spend toward channels with the best ratio, not the lowest CAC. A channel with $200 CAC and 3.5:1 ratio beats a channel with $100 CAC and 1.5:1 ratio.
4. Reduce Fully Loaded CAC
Audit the salary, agency, and tooling allocations in your CAC. A common finding: 30% of the growth team's time is spent on reporting, meetings, and low-impact experiments that do not drive acquisition. Reclaim that time for high-impact activities. Review agency contracts annually — fees tend to inflate while performance plateaus. Consolidate tooling — most growth teams use 8 to 12 software tools when 4 to 5 would suffice.
5. Increase Average Order Value (Ecommerce) or ARPU (SaaS)
For ecommerce, increasing AOV from $45 to $55 (through bundling, free shipping thresholds, or upsells) increases LTV proportionally if repeat rate holds constant. For SaaS, moving customers from a $49 to a $79 plan tier increases LTV by 61% if churn stays flat. The key constraint: do not raise prices or push upsells in ways that increase churn. The net effect on LTV:CAC must be positive.
When a Low Ratio Is Okay (and When It Is Not)
Not every business below 3:1 is broken. Context determines whether a low ratio is a signal to fix or a signal to wait. Here are the scenarios where a low LTV:CAC ratio is acceptable — and the scenarios where it is not.
Acceptable: early-stage SaaS proving product-market fit. A pre-Series A company with 18 months of history may run at 1.8:1 while iterating on pricing, onboarding, and core features. The ratio is low because the product is not yet optimized for retention, not because the unit economics are structurally flawed. The path forward: improve onboarding completion rate, reduce time-to-value, and build expansion revenue mechanics. The timeline: 6 to 12 months to reach 2.5:1 or better.
Acceptable: ecommerce brand launching a new category. A D2C brand entering a new product line may accept 1.5:1 for the first 6 to 12 months while building repeat purchase behavior and brand recognition. The first cohorts are expensive to acquire and slow to repeat. Later cohorts, acquired through word-of-mouth and organic channels, improve the blended ratio over time.
Acceptable: enterprise SaaS with long sales cycles. A $50K ACV enterprise deal may take 9 to 12 months to close, producing a high CAC in the acquisition quarter. But the LTV over 36 to 48 months is substantial. The ratio looks low in month 6 and strong in month 24. Measure enterprise LTV:CAC on a rolling 24-month basis, not quarterly.
Not acceptable: sustained low ratio with no improvement plan. A Series B SaaS running at 1.5:1 for three consecutive quarters with no churn reduction initiative, no pricing experiment, and no CAC optimization is a business in distress. The low ratio is not an investment — it is a leak.
Not acceptable: low ratio masked by high burn. Some companies fund low LTV:CAC ratios with venture capital, acquiring customers at a loss and hoping to improve economics at scale. This works only if the improvement is demonstrable and near-term. If the ratio has not improved after 18 months of scale, the model is not "early" — it is broken.
Not acceptable: low ratio from a single broken channel. A blended 2.8:1 ratio can hide one channel at 5:1 and another at 0.8:1. The broken channel is destroying value with every dollar spent. The fix: measure per channel, kill the underperformers, and reallocate.
Decision framework
A low LTV:CAC ratio is acceptable when it is a deliberate investment with a defined path to improvement, a measurable timeline, and a clear owner. It is not acceptable when it is the default state, unexplained, or funded indefinitely by external capital.
How Fairview Tracks LTV:CAC Automatically
Fairview connects to HubSpot, Salesforce, Pipedrive, Stripe, Shopify, QuickBooks, Xero, Google Ads, and Meta Ads via native OAuth. Once connected, Fairview reconstructs acquisition cohorts, calculates contribution-margin LTV on a 24-month horizon, and sits it next to fully loaded CAC per channel.
The Margin Intelligence feature pulls revenue data from Stripe or Shopify and cost data from QuickBooks or Xero. It applies attribution logic to allocate ad spend to revenue by channel. The result is profit per campaign, per channel, per SKU — not just total revenue. For LTV:CAC, this means the contribution margin layer is calculated automatically, not estimated.
The Pipeline Health Monitor tracks deal progression for SaaS customers, reading deal stage, close date, and last activity from the connected CRM. This feeds into the Forecast Confidence Engine, which generates a weekly revenue forecast based on pipeline stage, historical close rates, and deal velocity. The forecast accuracy improves week over week as Fairview compares actual-to-forecast.
When a channel's LTV:CAC drifts below your configured threshold, Fairview's Next-Best Action Engine generates a specific, named recommendation: "Meta Prospecting LTV:CAC dropped from 3.1 to 2.2 over the last three cohorts. Contribution margin per customer fell $6, CAC rose $18. Review audience mix and landing-page tests." The action is assigned, not left to inference.
The Weekly Operating Report summarizes the prior week: revenue vs. forecast, margin vs. prior period, pipeline changes, and the top three anomalies or risks detected. Operators arrive at their Monday review already briefed, not building spreadsheets.
Setup time for the first integration is under 10 minutes. Fairview's Data Connection Layer normalizes inconsistent data across sources, handles duplicate records, and refreshes on a configurable cadence. Companies recover an average of 23% of leaking margin in the first 90 days.
Per channel
LTV:CAC, not just blended
24 mo
Capped horizon, honest LTV
10
Native integrations live today
How do you calculate LTV:CAC ratio?
Divide contribution-margin lifetime value by fully loaded customer acquisition cost. Cap LTV at a fixed horizon — 24 months for ecommerce, 36 months for SaaS — so the number reflects retention you have observed rather than retention you assume. Include salaries, tooling, agency fees, and content production in CAC, not just ad spend.
What is the difference between gross margin and contribution margin for LTV?
Gross margin is revenue minus cost of goods sold. Contribution margin goes further, subtracting all variable costs: payment processing fees, shipping, returns, variable support, and fulfillment. For ecommerce, the gap between gross and contribution margin is typically 15 to 25 percentage points. Using gross margin instead of contribution margin inflates LTV by 30 to 60%.
Why is the 3:1 LTV:CAC rule misleading?
The 3:1 rule ignores timing, treats forecasted LTV as certain, and averages across channels. A 3:1 ratio delivered over 24 months of payback is a cash crisis. A 2:1 ratio paid back in six months is a compounding machine. Always pair LTV:CAC with CAC payback period and measure per channel to find the real drivers.
How do you calculate LTV for ecommerce?
Average order value multiplied by contribution margin percentage, multiplied by expected orders per customer within the horizon. Cap the horizon at 24 months. Do not use gross margin — shipping, returns, and processing fees matter too much. Measure repeat orders from observed cohorts, not industry averages.
Is a low LTV:CAC ratio ever acceptable?
Yes, temporarily. Early-stage SaaS companies often run below 2:1 while proving product-market fit. Ecommerce brands launching a new category may accept 1.5:1 for the first 6 to 12 months while building repeat purchase behavior. The key distinction: a low ratio is acceptable as a deliberate investment with a path to improvement, not as a permanent state.
What LTV:CAC ratio do investors expect?
Series A and later SaaS investors typically expect 3:1 with 12 to 18 month CAC payback, and 4:1 or better at Series B. Ecommerce investors accept 2.5:1 if repeat rate is above 40% and first-order contribution is positive. The ratio alone does not close rounds — it must sit alongside payback, retention, and contribution margin.
Key Takeaways
- LTV:CAC equals contribution-margin LTV (capped at 24 to 36 months) divided by fully loaded CAC. Any other definition is optimistic.
- SaaS healthy equals 3:1 for SMB, 3.5:1 for mid-market, 4:1 for enterprise. Ecommerce healthy equals 2.5:1 to 3:1 on a 24-month horizon.
- A good ratio with a bad payback is still a cash crisis. Pair LTV:CAC with CAC payback period in every operating review.
- Blended ratios hide broken channels. Always measure per channel and per cohort to find the real drivers.
- The five levers to improve the ratio: increase contribution margin, improve retention, optimize by channel, reduce fully loaded CAC, and increase AOV or ARPU.
- A low ratio is acceptable as a deliberate investment with a defined path to improvement. It is not acceptable as a permanent, unexplained state.