TL;DR
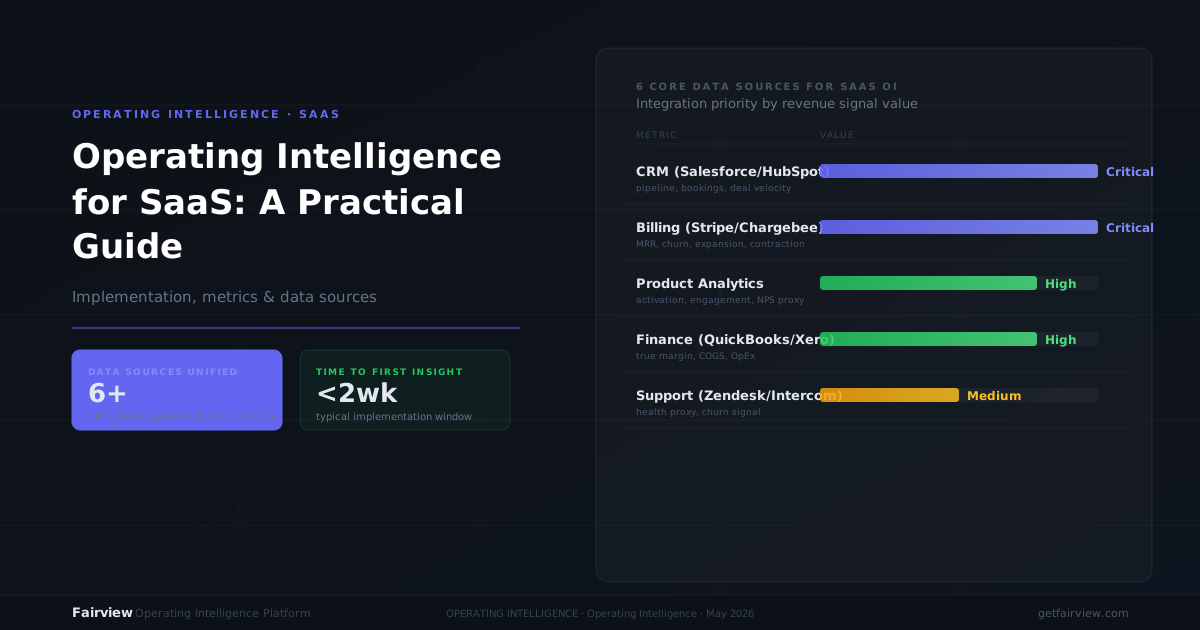
- Six data sources: CRM, finance, payment processor, ad platforms, product analytics, and support data form the foundation of operating intelligence for SaaS companies. Connect them in that order.
- Four implementation phases: Data connection and normalization (weeks 1–2), operating view construction (weeks 3–4), anomaly detection and alerting (weeks 5–6), and action automation (weeks 7–8). Most teams see value within 48 hours of the first connection.
- Four metric categories: Revenue metrics (MRR, NDR, expansion), unit economics (CAC, payback, LTV:CAC), pipeline health (coverage, velocity, win rate), and operating signals (activation, time-to-value, support load). Track them in context, not isolation.
- The SaaS-specific gap: SaaS companies lose 4–6 hours per week to manual data assembly. 68% of organizations cite data silos as their primary concern. Operating intelligence closes the gap between data visibility and decision-making.
- Decision signal: If your Monday review ends with visible metrics but no assigned actions, you do not need more dashboards. You need an operating intelligence layer that surfaces what to do next.
Most SaaS operators who search for operating intelligence already own a CRM, a finance tool, and a dashboard or two. They can see their MRR. They can see their pipeline. They still sit in Monday reviews where the numbers are visible and the decisions are not. The gap between data and action is not a tools problem. It is an operating architecture problem.
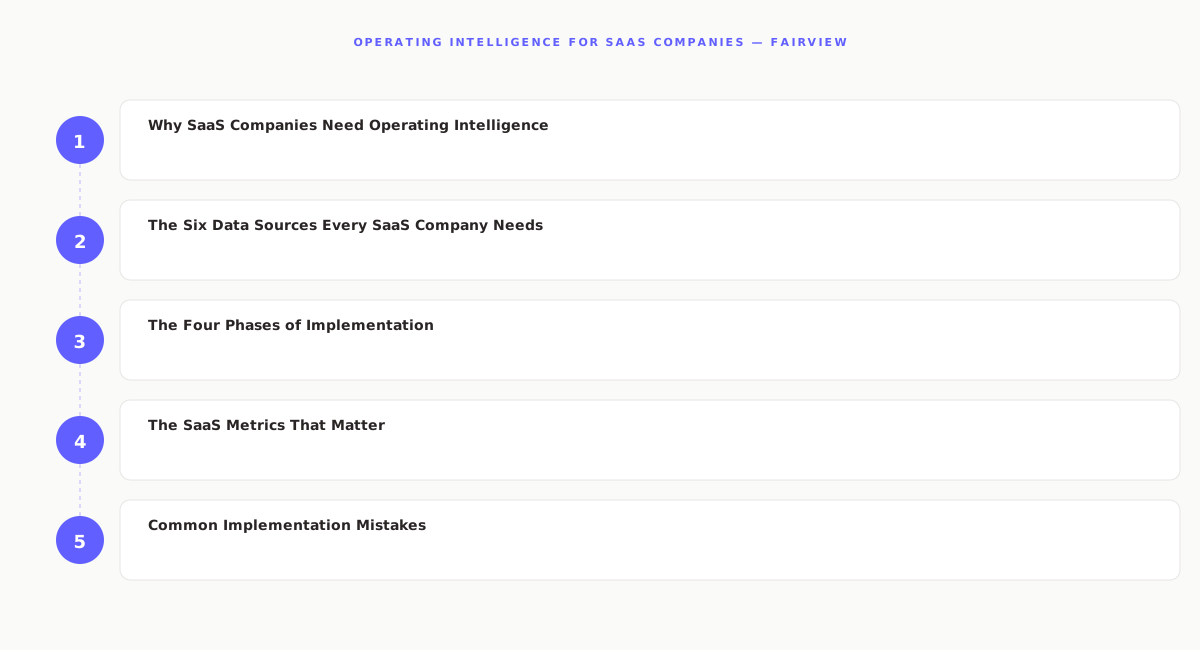
This post is a practical implementation guide for SaaS companies that want to close that gap. It covers the six data sources you need, the four phases of implementation, the metrics to track, and the common mistakes that stall most deployments. By the end, you will have a clear plan for building an operating intelligence layer that turns fragmented data into decisive action.
Why SaaS Companies Need Operating Intelligence
SaaS companies generate more data per dollar of revenue than almost any other business model. Every subscription creates a billing record. Every login creates a product event. Every support ticket creates a health signal. Every ad click creates an acquisition cost. The data is rich. The problem is that it lives in six different tools that do not talk to each other.
Research from GrowthHQ found that 68% of organizations cite data silos as their primary concern in 2025, up 7% in just one year. For SaaS companies, the impact is specific and measurable: operators spend 4–6 hours per week pulling data from CRM, finance, product, and ad platforms, normalizing it in spreadsheets, and building the report that should have been automatic.
The cost is not just time. It is decision latency. A margin leak in your top acquisition channel goes undetected for three weeks because nobody compared ad spend to revenue in the same view. A cluster of deals stalls in Stage 3 because the pipeline report does not flag inactivity. A cohort of customers churns because support ticket volume spiked two weeks before the cancellations, but support data never reached the operating review.
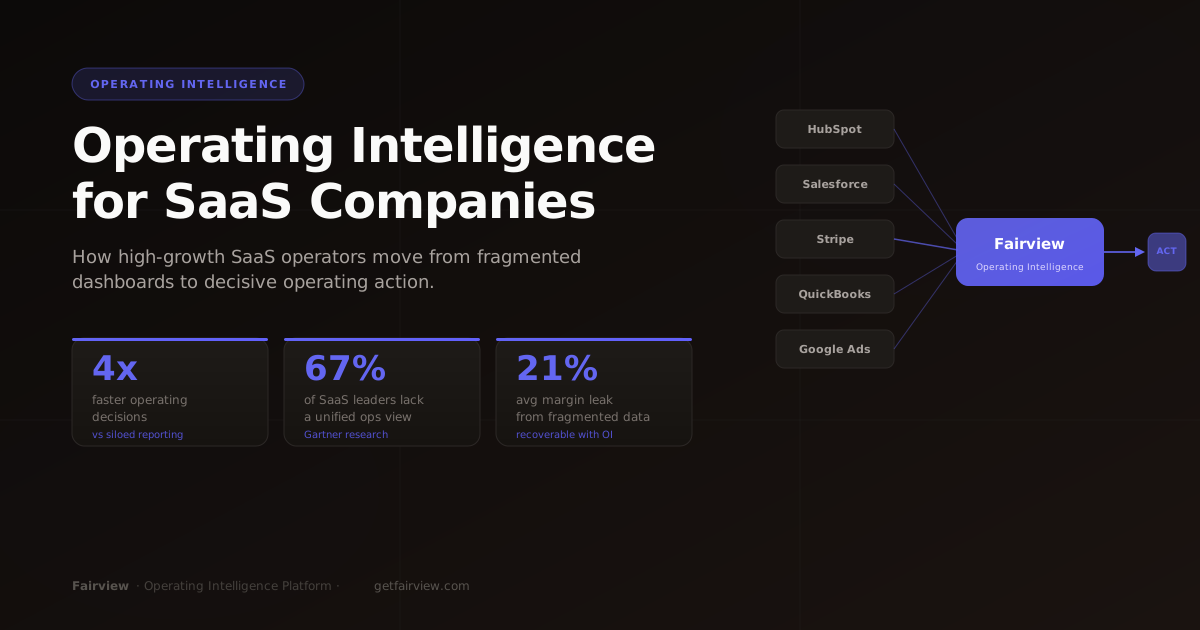
Operating intelligence solves this by connecting the data sources, normalizing the data, and surfacing not just the metrics but the actions that follow from them. For SaaS companies, this is not a nice-to-have. It is the difference between running the business and watching it run.
The Six Data Sources Every SaaS Company Needs
Operating intelligence requires data. The quality of your recommendations depends on the quality and completeness of what you connect. For SaaS companies, six sources form the core stack. The order in which you connect them matters.
1. CRM: HubSpot, Salesforce, or Pipedrive
Your CRM is the source of truth for pipeline, deals, and sales activity. Operating intelligence reads deal stage, close date, deal value, last activity date, and win/loss status. It calculates pipeline coverage, velocity by stage, and win rate. It flags deals with no activity in a configurable number of days.
Data quality matters here. If 30% of your deals have blank close dates, pipeline forecasting will be unreliable regardless of the tool. Before connecting, run a CRM hygiene pass: fill blank fields, deduplicate companies, and standardize stage names. The time invested pays back within the first week of automated reporting.
2. Finance tool: Stripe, QuickBooks, or Xero
Revenue data lives in your finance tool. For SaaS companies, this means subscription revenue, expansion revenue, contraction revenue, and churn. Operating intelligence reads MRR, ARR, net dollar retention, and gross revenue retention. It compares actual revenue to forecasted revenue and flags variance.
The key integration point is customer mapping. Revenue in Stripe must map to accounts in your CRM. If Stripe customer IDs do not match CRM company records, the operating view cannot connect pipeline to revenue. Most platforms handle this through a guided mapping flow, but the mapping decisions are yours.
3. Payment processor: Stripe, Chargebee, or Recurly
For SaaS companies, the payment processor is often the same as the finance tool, but the data model differs. The payment processor tracks individual transactions: subscription creation, upgrade, downgrade, cancellation, and payment failure. Operating intelligence reads these events to detect churn signals, expansion opportunities, and billing issues before they become revenue problems.
Payment failure is a leading indicator of churn. An operating intelligence platform that monitors payment failure rate by cohort can flag at-risk accounts before they cancel. This requires real-time or near-real-time data refresh, which is why payment processor integration is typically the third source, not the first.
4. Ad platforms: Google Ads, Meta Ads, LinkedIn Ads
Acquisition cost data lives in your ad platforms. Operating intelligence reads spend by campaign, channel, and audience, then attributes that spend to revenue by connecting ad data to CRM and finance data. The result is true CAC by channel, not just spend by channel.
This is where most SaaS companies discover their first margin leak. The channel that generates the most leads is rarely the channel that generates the most profitable customers. Operating intelligence surfaces this by connecting ad spend to lifetime value, not just to lead volume. For a deeper look at this calculation, see our guide on how to calculate marketing channel ROI honestly.
5. Product analytics: Amplitude, Mixpanel, or Pendo
Product usage data tells you which customers are healthy, which are at risk, and which are ready to expand. Operating intelligence reads activation rate, feature adoption, session frequency, and time-to-value. It correlates product usage with revenue outcomes: activated accounts have higher retention, power users have higher expansion rates.
Product data is often the most fragmented source. Events are tracked differently by different teams. Before connecting, agree on a core event taxonomy: what counts as activation, what counts as engagement, what counts as a power user. Without this standardization, product metrics will be noisy and recommendations will be unreliable.
6. Support platform: Zendesk, Intercom, or Help Scout
Support data is the earliest warning system for churn. Operating intelligence reads ticket volume, response time, resolution time, and sentiment by account. A spike in tickets from a single account is a churn signal. A pattern of tickets about the same feature is a product signal. Both belong in the operating view.
Support data is typically the last source to connect, but it is often the most actionable. The account with 12 tickets in 30 days is at risk. The account with zero tickets and declining product usage is also at risk. Operating intelligence surfaces both patterns automatically.
The Four Phases of Implementation
Implementing operating intelligence is not a single project. It is a sequence of four phases, each building on the last. Most SaaS companies complete the first two phases in under two weeks. The full deployment takes 6–8 weeks.
Phase 1: Data connection and normalization (weeks 1–2)
The first phase connects your core data sources and normalizes the data across them. Start with CRM and finance. These two sources give you pipeline and revenue, which is enough to build a basic operating view.
Normalization is the step most teams underestimate. Your CRM records revenue at close date. Your finance tool records revenue at invoice date. Your payment processor records revenue at transaction date. These three dates may differ by days or weeks. Operating intelligence needs a single definition of revenue. Pick one, document it, and apply it consistently.
The same problem exists for customer identity. A company in your CRM may have a different name in Stripe, a different ID in your product analytics tool, and a different email domain in your support platform. Operating intelligence needs a single customer key. Build a mapping table that connects these identities. Most platforms handle this through automated deduplication, but the initial mapping requires human judgment.
Phase 2: Operating view construction (weeks 3–4)
Once data is connected and normalized, build the operating view. This is the single screen that surfaces the metrics that matter to your operating rhythm. For SaaS companies, the operating view has four panels:
Revenue panel: MRR, ARR, net dollar retention, gross revenue retention, and expansion rate. Show current period vs. prior period. Flag changes automatically.
Unit economics panel: CAC by channel, CAC payback period, LTV:CAC ratio, and gross margin. Show these metrics at the company level and by segment.
Pipeline panel: Pipeline coverage ratio, weighted pipeline value, velocity by stage, win rate, and forecast confidence. Flag deals at risk.
Operating signals panel: Activation rate, time-to-value, support ticket volume, and payment failure rate. Flag accounts that need attention.
The operating view is not a dashboard. It is a decision surface. Every metric should connect to an action. If a metric cannot trigger a decision, remove it. For guidance on building this view, see our post on how to run a weekly business review that actually changes behavior.
Phase 3: Anomaly detection and alerting (weeks 5–6)
With the operating view in place, add continuous monitoring. The system watches your connected data and flags deviations from expected patterns. A margin drop of 15% on paid search triggers an alert. A cluster of deals stalling in Stage 3 surfaces before the close date slips. A cohort of customers with declining product usage flags as at-risk.
Alert tuning is critical. Too many alerts and the team ignores them. Too few and risks go undetected. Start with high-signal, low-noise rules: margin changes over 10%, pipeline coverage below 3×, deals with no activity in 14+ days, payment failure rate above 5%. Tune these thresholds based on your business rhythm.
Phase 4: Action automation (weeks 7–8)
The final phase connects insights to actions. When the system detects an anomaly, it generates a specific, named recommendation and assigns it to a team member. Not a generic alert. A specific action.
Examples of automated actions for SaaS companies:
- "Margin on LinkedIn Ads dropped 18% this week. Review campaign spend by audience segment."
- "3 deals in Stage 4 have no activity in 14+ days. Assign follow-up tasks to account executives."
- "Stripe data shows 2 accounts downgraded this week. Check product usage signals and schedule expansion calls."
- "Support tickets from Enterprise segment up 40% this week. Review top issue categories and assign to product team."
Action automation is what separates operating intelligence from passive dashboards. The system does not just show you the number. It tells you what to do about it.
The SaaS Metrics That Matter
Operating intelligence is only as good as the metrics it tracks. For SaaS companies, the metric set is well-established but often tracked in isolation. The value of operating intelligence is connecting these metrics into a coherent operating picture.
Revenue metrics
MRR and ARR are the headline numbers, but operating intelligence tracks them with context. MRR growth of 8% month-over-month is good. MRR growth of 8% with net dollar retention of 95% and CAC payback of 18 months is a different picture. The operating view shows all three metrics together, not in separate reports.
Net dollar retention (NDR) is the most important SaaS metric after ARR. It tells you whether your existing customer base is growing or shrinking. Operating intelligence tracks NDR by segment, by cohort, and by customer success manager. A drop in NDR for the Enterprise segment is a different problem than a drop for the SMB segment. The system flags the segment, not just the aggregate.
For NDR benchmarks by company size, see our guide on net dollar retention benchmarks for SaaS by company size.
Unit economics
CAC, CAC payback, and LTV:CAC ratio are the foundation of SaaS unit economics. Operating intelligence calculates these metrics using fully loaded costs, not just ad spend. Fully loaded CAC includes sales salaries, marketing salaries, tool costs, and overhead. Most SaaS companies understate CAC by 30–50% by omitting these costs.
The operating view shows CAC by channel, by campaign, and by customer segment. It tracks CAC payback over time and flags when payback extends beyond your target. For a $500/month product, a 12-month payback is acceptable. A 24-month payback is a burn risk. The system flags the threshold you set.
Pipeline metrics
Pipeline coverage ratio, velocity, and win rate predict revenue outcomes. Operating intelligence tracks these metrics continuously, not just at the end of the quarter. A pipeline coverage ratio of 2.5× in week 3 of the quarter is a different signal than 2.5× in week 10. The system flags coverage trends, not just snapshots.
Forecast accuracy is the metric that separates good operators from great ones. Operating intelligence compares actual revenue to forecasted revenue week over week and calculates forecast error. The goal is not perfect accuracy. The goal is predictable accuracy: knowing that your forecast is typically within 5% so you can plan around it.
Operating signals
Product usage, support volume, and payment health are the leading indicators of revenue outcomes. Operating intelligence correlates these signals with revenue data to surface at-risk accounts and expansion opportunities before they show up in the churn or upsell report.
Activation rate is the most predictive product metric for SaaS. Accounts that reach activation in the first 30 days have retention rates 2–3× higher than accounts that do not. Operating intelligence tracks activation by onboarding cohort, by plan, and by acquisition channel. It flags onboarding flows with low activation so the product team can prioritize fixes.
Common Implementation Mistakes
Most operating intelligence deployments stall for predictable reasons. Here are the five mistakes we see most often, and how to avoid them.
Mistake 1: Connecting everything at once
The temptation is to connect all six data sources in week one. This creates a normalization nightmare. Start with CRM and finance. Get those two sources clean and reliable. Then add ad platforms. Then product data. Then support. Each new source improves the operating view, but only if the existing sources are stable.
Mistake 2: Tracking vanity metrics
The operating view should contain only metrics that trigger decisions. Website traffic, social media followers, and email open rates are interesting. They rarely trigger operating decisions. If a metric cannot answer the question "what should I do about this?" it does not belong in the operating view.
Mistake 3: Ignoring data quality
Operating intelligence is garbage-in, garbage-out. If 40% of your CRM deals have blank close dates, pipeline forecasting will be wrong. If Stripe customer IDs do not map to CRM accounts, revenue attribution will be wrong. If product events are tracked inconsistently, usage metrics will be wrong. Invest in data quality before investing in intelligence.
Mistake 4: Setting alerts and forgetting them
Alert thresholds need tuning. An alert that fires every day becomes noise. An alert that never fires is probably set too high. Review alert performance monthly. Adjust thresholds based on false positive and false negative rates. The goal is high-signal alerting, not comprehensive alerting.
Mistake 5: Treating OI as a reporting tool
Operating intelligence is not a better dashboard. It is a decision system. The test of a successful deployment is not whether the metrics are visible. It is whether decisions are faster, more specific, and more accurate than before. If your Monday review still ends with "we will look into that," the deployment has not succeeded.
How Fairview Implements Operating Intelligence for SaaS
This post has focused on the general principles of operating intelligence implementation. It is worth being explicit about how Fairview handles the specific challenges SaaS companies face.
The data foundation
Fairview's Data Connection Layer connects to the six core SaaS sources: CRM (HubSpot, Salesforce, Pipedrive), finance tools (Stripe, QuickBooks, Xero), ad platforms (Google Ads, Meta Ads, HubSpot Marketing Hub), and product analytics via API. It normalizes data across sources, handles duplicate records and field mapping, and refreshes on a configurable cadence. The first integration goes live in under 10 minutes.
For SaaS companies, the critical normalization step is revenue recognition. Fairview handles the mapping between CRM close dates, Stripe transaction dates, and invoice dates. It applies a single definition of MRR and ARR across all sources. This eliminates the reconciliation work that costs operators hours each week.
The operating view
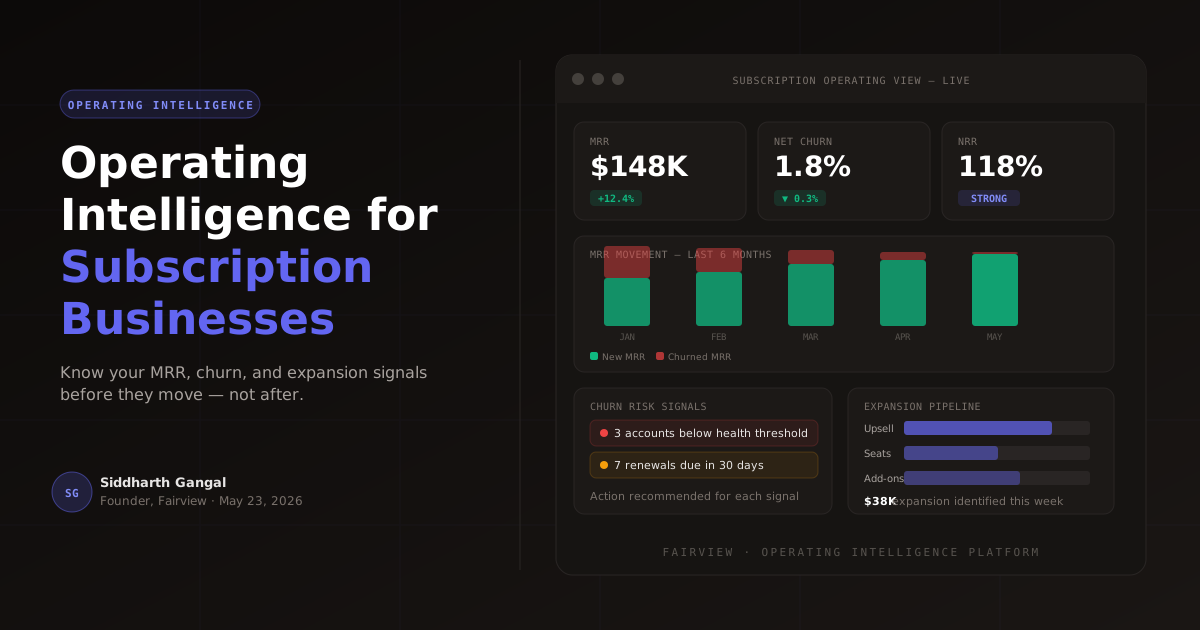
The Operating Dashboard surfaces the four metric panels SaaS companies need: revenue, unit economics, pipeline, and operating signals. It shows MRR, NDR, CAC, payback, pipeline coverage, and activation rate in one view. It flags changes from the prior period automatically. No manual comparison required.
The dashboard is built for operators, not analysts. It does not require SQL, custom queries, or report building. The metrics appear automatically once the data sources are connected.
Margin intelligence
Fairview's margin layer pulls revenue data from Stripe and Shopify, cost data from QuickBooks and Xero, and applies attribution logic to allocate ad spend to revenue by channel. For SaaS companies, this means true CAC by channel, not just spend by channel. It means contribution margin by customer segment, not just gross margin at the company level.
Companies using this feature recover an average of 23% of leaking margin in the first 90 days. The typical leak is an acquisition channel that generates leads but not profitable customers. Operating intelligence surfaces this by connecting ad spend to lifetime value.
Pipeline and forecast
The Pipeline Health Monitor tracks deal progression across the pipeline and surfaces risk signals before deals fall through. It flags deals with no activity in a configurable number of days and close dates that have slipped. For SaaS companies with long sales cycles, this is the difference between hitting quarterly commit and missing it.
The Forecast Confidence Engine produces a confidence-weighted revenue forecast with an optimistic-to-conservative range, not just a single number. It compares actual-to-forecast week over week to improve accuracy over time. Most SaaS companies start with forecast accuracy of plus or minus 15%. Within 90 days of using the engine, accuracy typically improves to plus or minus 5%.
The action layer
The Next-Best Action Engine is the feature that most clearly separates Fairview from passive dashboards. When Fairview detects an anomaly, it generates a specific, named recommendation. The action is assignable, not left to inference.
Examples of actions Fairview triggers for SaaS companies:
- "Margin on paid search dropped 18% this week. Review Google Ads spend by campaign."
- "3 deals in Stage 4 have no activity in 14+ days. Assign follow-up tasks."
- "Stripe data shows 2 accounts downgraded this week. Check churn signals in HubSpot."
- "Net dollar retention for Enterprise segment dropped to 102%. Review expansion pipeline."
The weekly rhythm
Fairview generates a structured Weekly Operating Report sent to the operator's inbox every Monday morning. It summarizes the prior week: revenue vs. forecast, margin vs. prior period, pipeline changes, and open action items. It highlights the top 3 anomalies or risks detected that week. For SaaS operators, this replaces the 4–6 hours of manual report assembly with a 15-minute review.
For a template of what this report contains, see our post on weekly operating report template: what to include and why.
The honest scope
Operating intelligence does not replace every analytics use case. For deep exploratory analysis, custom cohort studies, and multi-dimensional drill-downs, a dedicated BI tool with a semantic layer is the right fit. Fairview is built for operators who need the data organized and the decision surface prepared, not for data scientists building custom models. Many SaaS companies run both: BI for the data team, OI for the operating team.
How long does it take to implement operating intelligence in a SaaS company?
Most SaaS companies see their first meaningful operating intelligence within 48 hours of connecting CRM and finance data. The first integration takes under 10 minutes. Within one week, the operating view replaces manual Monday report assembly. Within 30 days, anomaly detection surfaces margin leaks and pipeline risks that were previously invisible. Within 90 days, companies report recovering an average of 23% of leaking margin. The timeline depends on data quality: cleaner CRM records and accurate revenue recognition produce faster, more specific recommendations.
What is the difference between operating intelligence and business intelligence for SaaS?
Business intelligence organizes SaaS data into dashboards and reports, answering what happened. Operating intelligence goes further: it monitors data continuously, detects anomalies like margin drops or stalling deals, ranks them by revenue impact, and recommends specific actions. BI answers questions you ask. OI surfaces questions you did not know to ask and tells you what to do about them. For SaaS companies, this means the difference between seeing churn rate and knowing which three accounts to call this week.
What SaaS metrics should an operating intelligence platform track?
An operating intelligence platform for SaaS should track four metric categories. Revenue metrics: MRR, ARR, net dollar retention, gross revenue retention, and expansion revenue. Unit economics: CAC, CAC payback period, LTV:CAC ratio, gross margin, and contribution margin by channel. Pipeline metrics: pipeline coverage ratio, velocity by stage, win rate, and forecast accuracy. Operating metrics: days to close, activation rate, time-to-value, and support ticket volume per account. The platform should surface these metrics in context, not in isolation, and flag deviations from expected patterns automatically.
When should a SaaS company invest in operating intelligence?
A SaaS company should invest in operating intelligence when three signals appear: the Monday review is a reporting exercise instead of a decision exercise, insights from dashboards sit unaddressed for weeks because nobody owns the next step, and the team spends more time assembling data than acting on it. The typical trigger is $3M–$10M ARR with a working data infrastructure but a broken operating rhythm. Earlier-stage companies should focus on data quality first. Later-stage companies may need both BI for the data team and OI for the operating team.
Key takeaways
- SaaS companies generate more data per dollar of revenue than any other business model, but that data lives in six disconnected tools. Operating intelligence connects them into one operating view.
- The six core data sources are CRM, finance tool, payment processor, ad platforms, product analytics, and support platform. Connect them in that order, starting with CRM and finance.
- Implementation has four phases: data connection and normalization (weeks 1–2), operating view construction (weeks 3–4), anomaly detection and alerting (weeks 5–6), and action automation (weeks 7–8).
- Track four metric categories: revenue (MRR, ARR, NDR), unit economics (CAC, payback, LTV:CAC), pipeline (coverage, velocity, win rate), and operating signals (activation, time-to-value, support load).
- The five most common implementation mistakes are connecting everything at once, tracking vanity metrics, ignoring data quality, setting alerts and forgetting them, and treating OI as a reporting tool instead of a decision system.
- 68% of organizations cite data silos as their primary concern. For SaaS companies, the cost is 4–6 hours of manual data assembly per week plus decision latency that compounds over time.
If your SaaS company is ready to move from data visible to decisions made, book a demo to see how Fairview connects your CRM, finance, and product data into one operating view — and surfaces the next action alongside every insight.