TL;DR
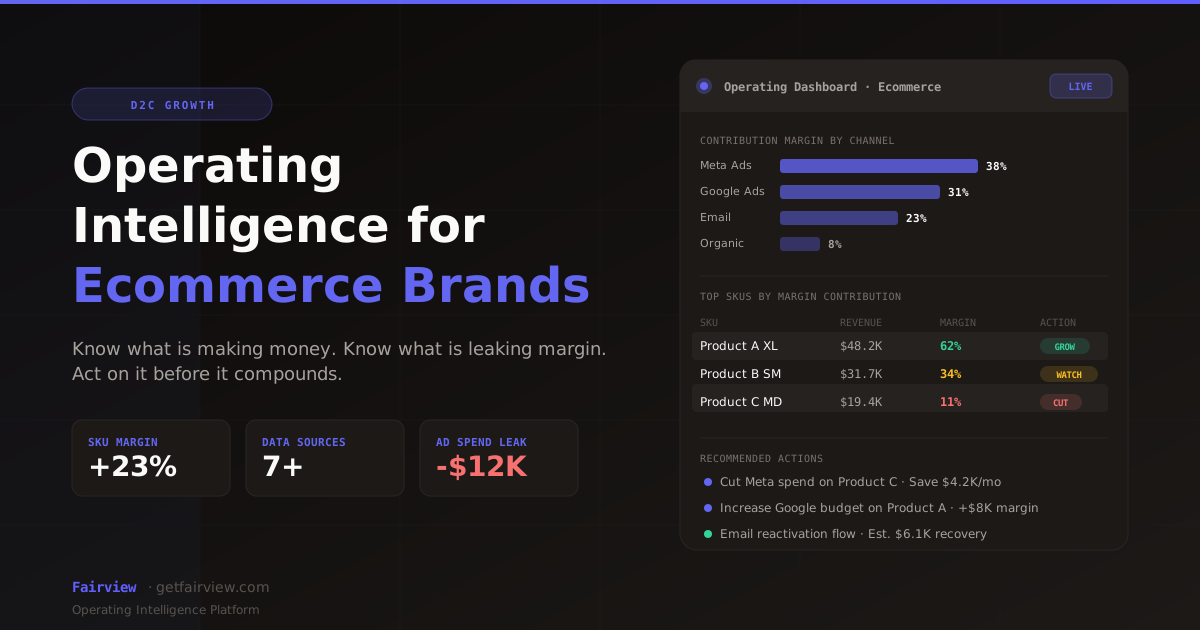
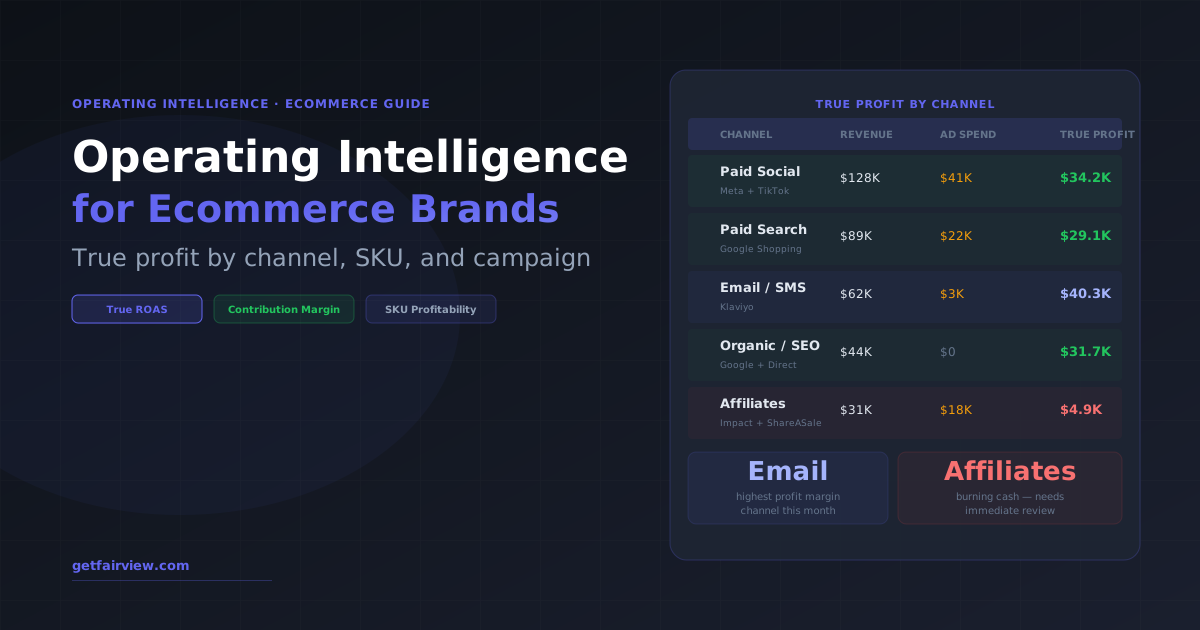
Operating intelligence for ecommerce connects your ad platforms, store data, COGS, and fulfillment costs into a single profit view by channel, SKU, and campaign. Instead of optimizing for the ROAS your ad dashboard reports, you optimize for contribution margin — the number that determines whether scaling a channel actually makes you money.
Why Revenue Is the Wrong Number to Optimize
Most ecommerce brands are managing their business from the wrong metric. They look at revenue, reported ROAS, and order counts. Their ad dashboards tell them a campaign is performing at 4× ROAS. Their Shopify dashboard shows revenue climbing. Everything looks healthy.
Then they look at their bank account and the math does not work.
The problem is that revenue is not profit. A Meta campaign reporting 4× ROAS might be generating a 1.8× true ROAS once you subtract product costs, fulfillment, returns, and payment processing fees. At that true ROAS, scaling the campaign destroys margin — but you cannot see it from the ad platform dashboard alone.
This is the core problem that operating intelligence solves for ecommerce brands. Not just better dashboards. A connected view of profit — where every revenue signal is automatically adjusted for the costs that determine whether that revenue was worth generating.
What Operating Intelligence Means for Ecommerce
For an ecommerce brand, operating intelligence is the capability to answer four questions in real time:
- Which channels are actually profitable? Not which channels generate the most revenue — which channels generate positive contribution margin after ad spend, COGS, fulfillment, and returns.
- Which SKUs are driving margin? Not which products sell the most — which products are profitable enough to justify their inventory investment and fulfillment cost.
- Which customer cohorts repurchase? Which acquisition channels bring customers who buy again? High LTV customers acquired cheaply are more valuable than high-AOV customers who never return.
- What is the actual CAC by channel? Not blended CAC — the cost to acquire a new customer specifically from each marketing channel, adjusted for attribution accuracy.
Without operating intelligence, answering any of these questions requires hours of manual data assembly across Shopify, Meta Ads Manager, Google Ads, Klaviyo, and your 3PL system. With operating intelligence, the answers are continuously updated.
The Ecommerce Data Problem: Four Systems That Never Talk
The reason most ecommerce brands cannot see true profit by channel is structural. Your operating data lives in four systems that were never designed to communicate:
- Commerce platform (Shopify, WooCommerce) — Orders, SKUs, revenue, refunds, customer data
- Ad platforms (Meta, Google, TikTok) — Spend, impressions, clicks, reported conversions, reported ROAS
- Email and SMS platform (Klaviyo, Attentive) — Send volume, revenue attributed, flow performance
- Fulfillment and COGS (3PL invoices, spreadsheets, Inventory Planner) — Shipping costs per order, product costs by SKU, return rates
When these systems are connected, you can calculate true contribution margin by channel automatically. When they are not connected, you are making allocation decisions based on partial information — and paying for it with compressed margins.
See What Is Connected Data? for the technical approach to solving the data silo problem.
True ROAS vs. Reported ROAS: The Gap That Kills Margins
This is the most important distinction in ecommerce operating intelligence. Reported ROAS is what your ad platform shows you. True ROAS is what you actually made after costs.
True ROAS Formula
True ROAS = (Revenue − COGS − Fulfillment − Returns − Payment Fees) ÷ Ad Spend
vs.
Reported ROAS = Revenue ÷ Ad Spend
Here is what the gap looks like in practice for a typical Meta campaign:
| Metric | Amount | % of Revenue |
|---|---|---|
| Revenue (what Meta reports) | $40,000 | 100% |
| Ad spend | ($10,000) | 25% |
| COGS (avg. 45% of revenue) | ($18,000) | 45% |
| Fulfillment + shipping | ($4,000) | 10% |
| Returns (12% return rate) | ($4,800) | 12% |
| Payment fees (2.9%) | ($1,160) | 2.9% |
| True contribution margin | $2,040 | 5.1% |
| Reported ROAS | 4.0× | |
| True ROAS | 1.2× |
At 1.2× true ROAS, scaling this campaign means scaling a near-breakeven channel. A brand optimizing for 4× reported ROAS and seeing no cash impact is in this situation without knowing it. Operating intelligence surfaces this automatically — so you scale the channels that make money, and fix or cut the ones that do not.
For the full methodology, see How to Calculate True ROAS for Ecommerce.
Contribution Margin by Channel: The Operating Intelligence Foundation
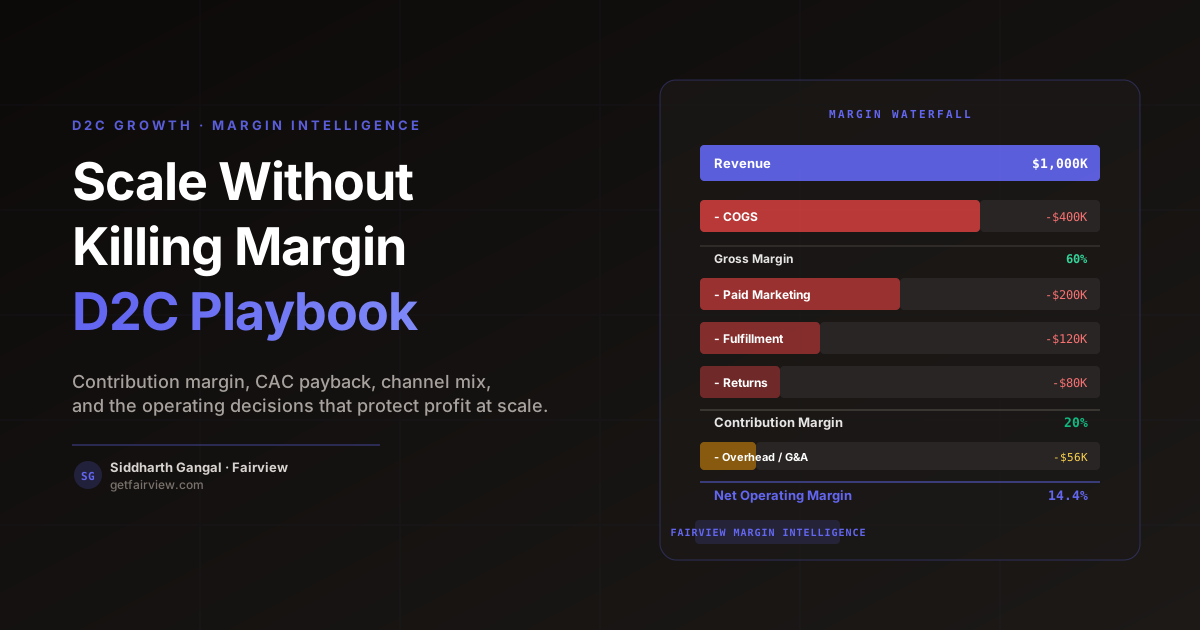
Contribution margin by channel is the core ecommerce operating metric. It measures how much profit each channel generates after all variable costs — and it is the metric that drives scaling decisions.
Contribution Margin by Channel Formula
Channel Contribution Margin = Channel Revenue − COGS − Fulfillment − Returns − Channel Ad Spend − Attribution-Adjusted Discounts
The challenge is attribution. In a multi-touch customer journey, a customer might click a Meta ad, open a Klaviyo email, and convert via a Google Shopping retargeting ad. Which channel gets credit for the contribution margin?
Different attribution models give different answers:
- Last-click — Google Shopping gets 100% of the credit. Massively overstates paid search, understates email and social.
- First-click — Meta gets 100% of the credit. Understates retention channels.
- Linear — Credit split equally across all touchpoints. Underweights the channels that actually drove intent.
- Data-driven — Credit allocated based on actual conversion contribution. Requires significant data volume to be reliable.
For most ecommerce brands at $2M–$20M revenue, the most practical approach is a blended model: use last-click as the baseline for ad channel optimization (since ad platforms optimize against last-click), and use linear or position-based for overall budget allocation decisions. See How to Calculate Contribution Margin by Channel for the full methodology.
SKU-Level Profitability: The Insight Most Brands Are Missing
Revenue by SKU is easy to see in Shopify. Profit by SKU requires connecting COGS data, return rates by product, and average fulfillment cost per product (weight and dimensions determine shipping cost).
When you build SKU-level profitability, three patterns emerge that are invisible from aggregate data:
Pattern 1: High-Revenue SKUs That Are Not Worth Stocking
A SKU generating $80K in monthly revenue at a 12% return rate and $22 average fulfillment cost may have a contribution margin of 8% — while a SKU generating $30K in revenue at a 4% return rate and $9 fulfillment cost generates a contribution margin of 34%. The smaller SKU is 4× more profitable per dollar of revenue. Operating intelligence makes this visible so you can prioritize inventory investment accordingly.
Pattern 2: Products That Correlate With High-LTV Customers
Some products are low-margin but correlate with customers who make 4+ repeat purchases. These acquisition SKUs destroy margin in the first transaction but generate significant LTV. Operating intelligence identifies these SKUs by connecting product purchase data with cohort retention curves — so you can actively promote them even at thin first-order margins.
Pattern 3: The 80/20 SKU Concentration
In most ecommerce brands, 20% of SKUs generate 80% of contribution margin. The other 80% of SKUs absorb warehouse space, working capital, and operational complexity for marginal contribution. Identifying this concentration is one of the highest-value outputs of SKU-level operating intelligence — because eliminating low-margin SKUs improves gross margin, frees working capital, and simplifies operations simultaneously.
Customer Cohort Intelligence: LTV That Accounts for Acquisition Cost
The most dangerous number in ecommerce is blended CAC. It averages acquisition costs across all channels and all customers — and hides the fact that some channels bring customers who never buy again, while others bring customers who generate 5× LTV.
Operating intelligence segments LTV by acquisition channel, so you can see:
- Meta customers acquired in Q4 2025 — average 2.1 purchases, $380 LTV, $62 CAC → 6.1× LTV:CAC
- Google Shopping customers acquired in Q4 2025 — average 1.4 purchases, $210 LTV, $58 CAC → 3.6× LTV:CAC
- Influencer customers acquired in Q4 2025 — average 1.1 purchases, $140 LTV, $89 CAC → 1.6× LTV:CAC
These numbers determine where to invest in customer acquisition — not just in Q4, but in every future period. The influencer channel may generate impressive first-order revenue while destroying LTV-based economics.
For benchmarks and methodology, see How to Improve Your LTV:CAC Ratio.
The Operating Intelligence Stack for Ecommerce Brands
Four data sources need to be connected for ecommerce operating intelligence. Here is what each contributes and what the connection enables:
| Data Source | What It Contributes | Connected Insight |
|---|---|---|
| Shopify / Commerce | Orders, SKUs, customers, refunds, discounts | Revenue by product, channel, customer cohort |
| Ad Platforms | Spend, impressions, reported conversions | True ROAS and contribution margin by campaign |
| COGS Data | Product cost by SKU, landed cost from supplier | Gross margin and contribution margin by product |
| Fulfillment / 3PL | Shipping cost per order, return processing costs | Net margin per order accounting for logistics |
When these four sources are connected, you get a contribution margin waterfall that updates automatically — so the decision to scale a channel, increase a SKU's reorder quantity, or cut an underperforming campaign is based on real-time profit data, not end-of-month reconciliation.
How to Build Your Ecommerce Operating Intelligence System
Step 1: Define Contribution Margin Consistently
Before connecting any tools, align on what counts in your contribution margin calculation. The most common definitions:
- Contribution Margin 1 (CM1) — Revenue minus COGS only. Best for SKU-level comparison.
- Contribution Margin 2 (CM2) — CM1 minus variable fulfillment and returns. Best for channel comparison.
- Contribution Margin 3 (CM3) — CM2 minus channel-specific ad spend. The true channel profitability metric.
Many ecommerce brands mix these without realizing it — comparing a SKU's CM1 to a channel's CM3. The result is misallocated budget. Define each metric explicitly and use the right one for each decision type.
Step 2: Connect Your Commerce and Cost Data
Start with Shopify and your COGS data. Map each SKU to its landed cost — including supplier cost, inbound freight, and import duties. This is the most labor-intensive step, but it is the foundation of every downstream profit calculation.
Then connect fulfillment data. If you use a 3PL, map fulfillment cost per order (either per-unit rates from your 3PL contract or actual invoice allocation). If you fulfill in-house, allocate labor and overhead costs to a per-order cost.
Step 3: Add Attribution Data
Connect your ad platforms and normalize spend data against order data. Use order-level data from Shopify (UTM parameters, order source) as the primary attribution signal, and ad platform data as the spend source. For channels where UTM tracking is unreliable (Meta in particular, due to iOS privacy changes), use a combination of incrementality testing and modeled attribution.
Step 4: Set Up Weekly Review Cadence
Operating intelligence only drives results when it feeds decisions. Establish a weekly review rhythm that answers three questions from your operating data:
- Which channels moved in true ROAS this week, and why?
- Which SKUs are approaching reorder points and what is their current contribution margin?
- What is the return rate trend, and is it correlated with a specific channel or SKU?
See How to Run a Weekly Business Review for the full cadence structure.
Common Mistakes Ecommerce Brands Make With Operating Data
Mistake 1: Trusting Platform-Reported ROAS
Every ad platform has an incentive to show you a high ROAS — it justifies your continued spend. Meta counts view-through conversions that Google does not count. Google counts cross-device conversions that Meta does not attribute. The result is that your platforms collectively claim more revenue than Shopify actually recorded — sometimes by 40–60% for mature accounts with heavy retargeting. Always reconcile ad platform revenue claims against Shopify order data before making scaling decisions.
Mistake 2: Ignoring Inventory Carrying Costs in SKU Analysis
A SKU with 28% contribution margin and a 180-day inventory turn is less capital-efficient than a SKU with 22% contribution margin and a 45-day turn. When COGS is tied up in slow-moving inventory, your effective margin is lower because that capital has an opportunity cost. Operating intelligence accounts for inventory velocity — not just margin rate.
Mistake 3: Optimizing CAC Without Segmenting by Customer Type
Blended CAC is meaningless for channel optimization. A brand with $45 blended CAC might have $28 CAC for their email channel (mostly remarketing to existing lists) and $110 CAC for their new-customer Meta acquisition. Optimizing against the blended number leads to underinvestment in the highest-LTV acquisition channels and overinvestment in cheap-but-low-quality traffic.
Mistake 4: Measuring LTV on Too Short a Window
30-day or 60-day LTV calculations dramatically undervalue customers who repurchase at 6 months or 12 months. For subscription-adjacent categories (skincare, supplements, pet food), 12-month LTV can be 3–5× the 30-day LTV. If your payback period analysis uses 30-day LTV, you will underinvest in acquisition relative to what the economics justify. Measure LTV at 6 months and 12 months, not just at 30 days.
How Fairview Handles Ecommerce Operating Intelligence
Fairview connects Shopify, Meta, Google, Klaviyo, and your COGS data into a single contribution margin view — by channel, SKU, and customer cohort. Instead of building this connection manually across spreadsheets, Fairview maintains it continuously as new order data, spend data, and cost data flows in.
When your true ROAS on a Meta campaign drops below your target threshold, Fairview flags it in your operating view — before you have spent another week scaling a campaign that is compressing margins. When a SKU's return rate spikes, you see it against that SKU's current inventory position and contribution margin.
For ecommerce brands that need the profit view without a six-person data team, Fairview provides it in days, not months. Book a demo to see how it works with your Shopify store and ad accounts.
What is true ROAS in ecommerce?
True ROAS accounts for COGS, fulfillment costs, returns, and payment fees — not just reported revenue. A campaign with a 4× reported ROAS on Meta may have a 1.8× true ROAS once you subtract product costs, shipping, and returns. True ROAS is the only ROAS metric that tells you whether a campaign is actually profitable.
What is the 80/20 rule in ecommerce?
The 80/20 rule in ecommerce suggests that roughly 80% of revenue typically comes from 20% of products or customers. In practice, the ratio varies by brand, but the principle is consistent: a small number of SKUs, channels, or customer cohorts generate most of the profit. Operating intelligence surfaces these concentrations automatically — which products, channels, and customer segments are driving profitable growth vs. diluting margins.
What is business intelligence in e-commerce?
Business intelligence in e-commerce refers to the collection, analysis, and visualization of store data — orders, traffic, conversion rates, inventory, and customer behavior — to support operational decisions. Operating intelligence goes a layer deeper, connecting this store data to financial outcomes like contribution margin and true ROAS so you can act on profitability signals, not just revenue signals.
How is operating intelligence different from Shopify analytics or Triple Whale?
Shopify analytics shows store-level revenue, traffic, and conversion. Triple Whale and similar tools focus on attribution and ad performance. Operating intelligence connects all of these — plus COGS, fulfillment, and inventory costs — into a unified view of contribution margin by channel and SKU. The difference is whether you see revenue or profit.
Key Takeaways
- →Reported ROAS and true ROAS are different numbers. The gap between them is where margin compression hides.
- →Contribution margin by channel (CM3) is the correct metric for scaling decisions — it accounts for ad spend, COGS, fulfillment, and returns.
- →SKU-level profitability reveals which products deserve inventory investment and which are destroying working capital.
- →Customer LTV segmented by acquisition channel shows where to invest in growth — blended CAC and blended LTV mask channel-specific economics.
- →Operating intelligence requires connecting four systems: commerce platform, ad platforms, COGS data, and fulfillment data.
See True Profit by Channel for Your Brand
Fairview connects your Shopify, Meta, Google, and COGS data into a live contribution margin view — updated daily, no data team required.
Book a Demo