TL;DR
- The cost: Ecommerce operators spend 8–15 hours per week assembling data from Shopify, Stripe, QuickBooks, and ad platforms into spreadsheets. At founder time, that is $20,800–$39,000 per year in labor alone.
- The gap: Spreadsheets show numbers. They do not detect anomalies, rank them by impact, or recommend actions. The operator who builds the report is the same person who must interpret it — and they are already exhausted from building it.
- The shift: Operating intelligence connects your ecommerce, payment, accounting, and ad data into one view. It monitors continuously, flags margin drops and channel underperformance automatically, and surfaces named next actions — not generic alerts.
- The outcome: Companies using operating intelligence recover an average of 23% of leaking margin in the first 90 days. The Monday review shifts from report assembly to decision-making.
- The signal: When manual reporting takes more than 4 hours per week and your weekly review is 80% presentation and 20% decision, you have outgrown the spreadsheet.
Most ecommerce brands between $1M and $20M in annual revenue are run from spreadsheets. The founder or COO exports order data from Shopify, revenue data from Stripe, cost data from QuickBooks, and spend data from Meta and Google Ads. Then they reconcile four different date formats, fix the SKU naming inconsistencies, build pivot tables, and email the result to the team by Tuesday afternoon. The report is accurate. It is also already stale.
This post is for operators who know the spreadsheet is not the problem — the time it consumes and the decisions it delays are. We will walk through what operating intelligence means for ecommerce specifically, why the spreadsheet-to-intelligence transition happens at a predictable inflection point, and how to make the shift without disrupting the operating rhythm that runs the business.
The Spreadsheet Tax on Ecommerce Operators
The spreadsheet is not a bad tool. It is the wrong tool for a job that has outgrown it. At small scale — one channel, 20 SKUs, a few hundred orders per month — a spreadsheet is fast, flexible, and free. The operator knows every cell by memory. The formulas are simple. The review takes 30 minutes.
At scale, the spreadsheet becomes a tax. Research from inventory management platforms shows that ecommerce brands with 100–500 SKUs across multiple channels spend 8–15 hours per week on spreadsheet-based data assembly. The work breaks into five categories:
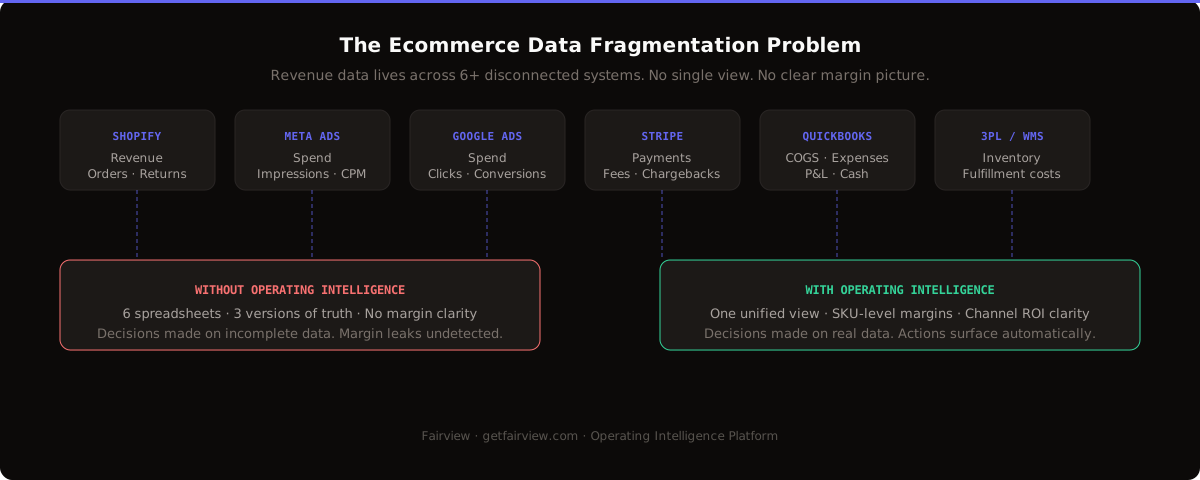
- Data extraction: Pulling exports from Shopify, Stripe, QuickBooks, Google Ads, Meta Ads, and sometimes Amazon or TikTok Shop. Each platform has its own export format, date range logic, and column naming.
- Data reconciliation: Matching orders in Shopify to payments in Stripe to invoices in QuickBooks. SKU names differ across platforms. Customer IDs do not align. Refunds appear in Stripe on one date and in Shopify on another.
- Metric calculation: Building formulas for contribution margin, ROAS, CAC, and LTV. Each formula references five to ten cells across multiple sheets. One broken reference corrupts the entire model.
- Report construction: Formatting the output into a view the team can read: charts, tables, week-over-week comparisons, channel-level breakdowns.
- Error correction: Finding and fixing the discrepancies that emerge when four data sources disagree. This is the most time-consuming category and the one that produces the most operator fatigue.
At $50 per hour founder time, 12 hours per week of spreadsheet work costs $31,200 per year in direct labor. The hidden cost is larger: every hour spent assembling data is an hour not spent diagnosing why Meta CAC rose 22% this week, or deciding whether to launch the new SKU, or negotiating better supplier terms. The spreadsheet does not just cost time. It costs decisions.
Why Ecommerce Data Is Harder Than It Looks
Ecommerce data looks simple from the outside. Orders, revenue, costs, profit. Four numbers. The reality is that each number lives in a different system, uses a different definition, and updates on a different cadence.
Revenue is not one number. Shopify reports gross merchandise value. Stripe reports net revenue after refunds and fees. QuickBooks reports recognized revenue on an accrual basis. The same transaction appears in all three systems with three different amounts. The operator who reports "revenue" without specifying which system and which definition is reporting a fiction.
Costs are distributed. Product cost lives in the accounting tool. Shipping cost lives in the fulfillment platform. Payment processing fees live in Stripe. Ad spend lives in Google Ads and Meta Ads. Returns processing lives in the warehouse management system. To calculate true contribution margin, the operator must pull from six or more sources and allocate each cost to the right order, channel, and SKU.
Attribution is contested. Meta claims credit for conversions that touched a Meta ad within the attribution window. Google claims credit for conversions that started with a search. The brand's own analytics claims credit based on the last click before purchase. Each platform is telling a partial truth. The operator who trusts any single platform's attribution is making allocation decisions on incomplete data.
Time lags create blind spots. An order placed today may not ship for two days. The shipping cost may not hit the accounting system for a week. The ad spend that generated the order was recorded yesterday. The refund may not process for 30 days. A spreadsheet snapshot taken on Monday captures a moment in time. It does not capture the lag structure that determines whether the order was actually profitable.
These are not edge cases. They are the daily reality of every ecommerce operator running a multi-channel brand. The spreadsheet handles them poorly because it was never designed to synchronize data across systems with different definitions, different cadences, and different owners.
What Operating Intelligence Means for Ecommerce
Operating intelligence is a category of software built for operators who need data organized and decisions prepared, not for analysts who need infinite flexibility. For ecommerce brands, it means four specific capabilities that the spreadsheet cannot replicate.
1. Automatic data connection and normalization
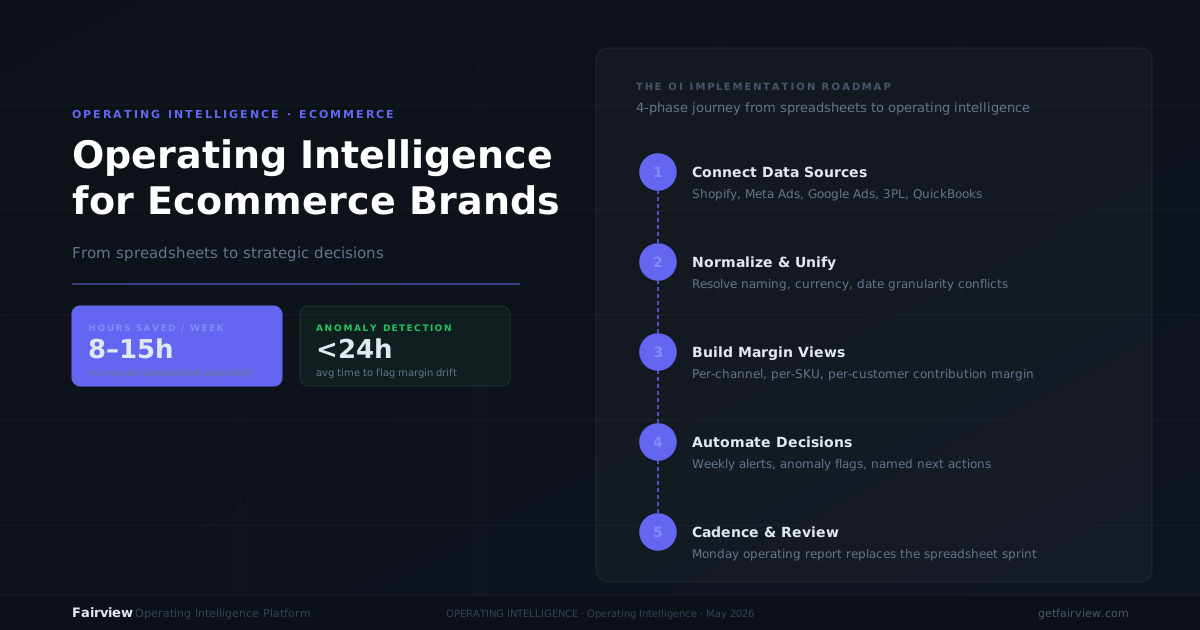
Operating intelligence platforms connect directly to the tools ecommerce operators already use: Shopify for orders and inventory, Stripe for payments and refunds, QuickBooks or Xero for costs, Google Ads and Meta Ads for spend. The connection is native, not via CSV export. The data refreshes daily or in real time, not when the operator remembers to run the export.
Normalization resolves the definition conflicts. A "customer" in Shopify is matched to a "contact" in HubSpot and a "company" in QuickBooks. Revenue is reconciled across GMV, net payment, and recognized revenue. SKU names are mapped across platforms. The operator sees one number for revenue, one number for cost, and one number for margin — not three conflicting versions.
2. Margin intelligence by channel, SKU, and campaign
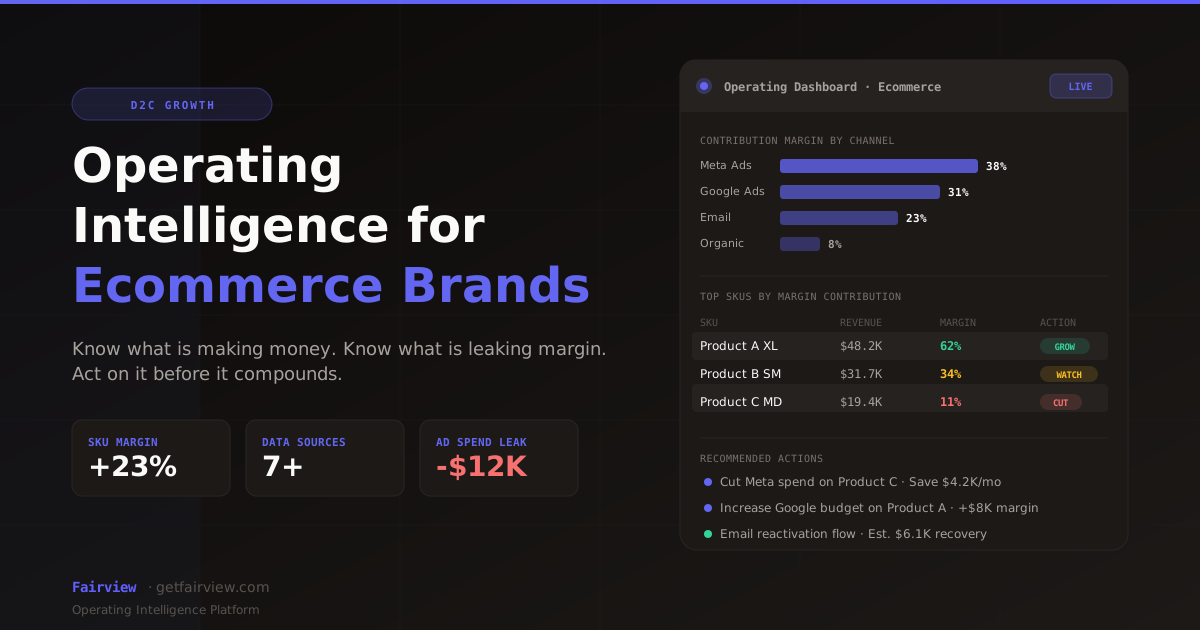
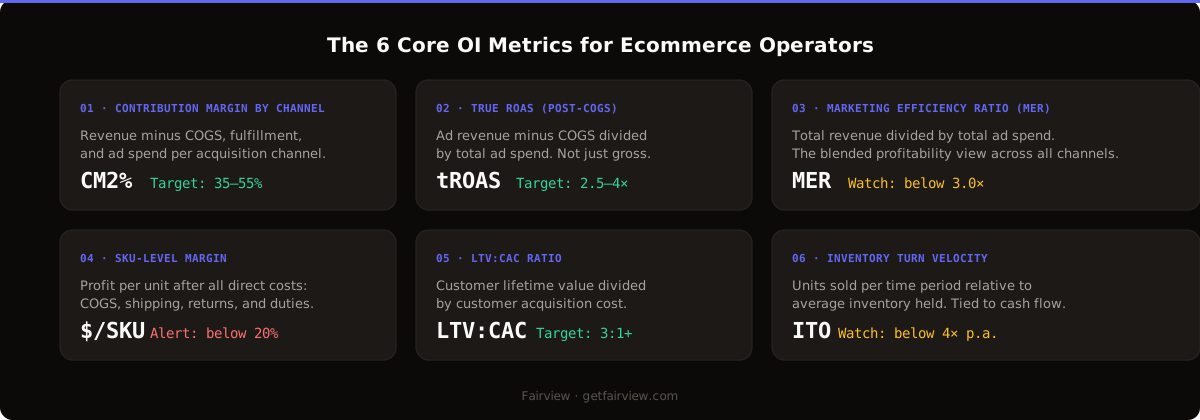
This is the capability that most clearly separates operating intelligence from business intelligence for ecommerce. Margin intelligence calculates contribution margin — revenue minus all variable costs — at the level where decisions are made. Not blended margin across all channels. Channel-level margin. Not average margin across all SKUs. SKU-level margin. Not campaign-level ROAS. Campaign-level profit.
The math is not complex. The data assembly is. To calculate true contribution margin per order, the platform must pull the order from Shopify, the payment from Stripe, the product cost from QuickBooks, the shipping cost from the fulfillment provider, the ad spend from the platform that drove the click, and the return status from the warehouse system. Then it must attribute each cost to the right order, account for time lags, and handle partial refunds. A spreadsheet can do this for 50 orders. It cannot do it for 5,000.
3. Anomaly detection and priority ranking
Operating intelligence monitors metrics continuously and flags deviations from expected patterns. A margin drop of 18% on paid search triggers an alert even if nobody ran a report that week. A cluster of returns from a specific SKU surfaces before the refund rate becomes a P&L problem. A CAC spike on a specific Meta audience is flagged before the monthly budget is exhausted.
Not every anomaly deserves attention. The platform ranks signals by business impact: revenue at risk, margin leakage rate, forecast variance. A $12K weekly revenue impact ranks higher than a 2% click-through rate change on a low-spend campaign. The operator sees the top three risks, not every metric that moved.
4. Named recommendations, not generic alerts
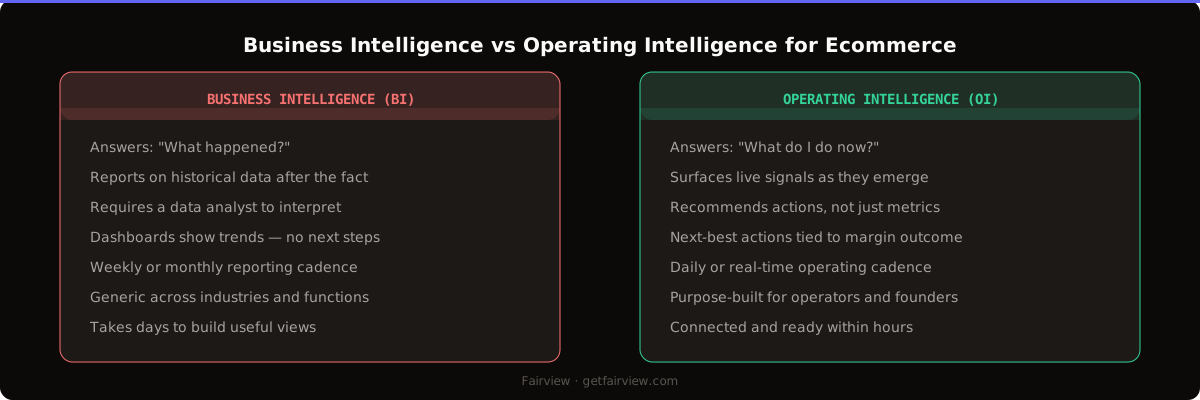
This is the defining feature of operating intelligence. A business intelligence alert says "Meta ROAS dropped below 3.0." An operating intelligence recommendation says "Meta ROAS dropped from 4.2 to 3.1, concentrated in audiences 25–34 Female and 35–44 Male. Estimated weekly revenue impact: $12K. Recommended action: pause Audience 25–34 Female, reallocate budget to Audience 35–44 Male, and refresh creative for the underperforming ad set."
The action is specific, named, and assignable. It turns a Monday review from a reporting exercise into a decision exercise. It also closes the gap between insight and behavior that causes most data deployments to stall.
The Five Stages of Ecommerce Data Maturity
Ecommerce brands do not jump from spreadsheets to operating intelligence overnight. They move through five stages, each with its own tools, its own pain points, and its own trigger for the next stage.
Stage 1: Platform-native reporting ($0–$500K revenue)
The operator relies on the built-in dashboards of Shopify, Stripe, and Meta Ads. Each platform reports its own metrics accurately. No cross-platform view exists. The operator makes decisions based on platform-specific numbers: Shopify revenue, Meta ROAS, Stripe net volume. The problem is not accuracy. It is incompleteness. A decision based on Meta ROAS alone ignores returns, shipping costs, and payment fees. The operator does not know their true margin. They know their platform-reported metrics.
Stage 2: Spreadsheet consolidation ($500K–$3M revenue)
The operator builds a master spreadsheet that pulls data from multiple platforms. This is the stage where most ecommerce brands live for 12–36 months. The spreadsheet is accurate when maintained. It is also fragile, time-consuming, and dependent on one person who knows how the formulas work. When that person is on vacation, the report does not get built. When they leave, the model degrades within a quarter.
Stage 3: BI dashboard deployment ($3M–$10M revenue)
The brand invests in a business intelligence tool: Looker, Tableau, Power BI, or Metabase. The data team builds dashboards that connect Shopify, Stripe, and ad platforms. The dashboards are accurate, automated, and visually polished. The problem is that they still require the operator to know which questions to ask. If nobody checks the dashboard on a Tuesday afternoon, a margin drop goes unnoticed until the Monday review. BI solves the assembly problem. It does not solve the action problem.
Stage 4: Operating intelligence adoption ($5M–$25M revenue)
The operator adds an operating intelligence layer that monitors data continuously, detects anomalies, and recommends actions. The Monday review shifts from "here is what happened" to "here is what to do about it." The operator spends 20 minutes reviewing pre-surfaced insights instead of 4 hours building reports. The team makes decisions faster because the data is organized and the next steps are named.
Stage 5: Automated operating rhythm ($20M+ revenue)
The operating intelligence platform runs the weekly review automatically. The report arrives Monday morning with revenue vs. forecast, margin vs. prior period, channel-level changes, and assigned action items. The operator's job is not to assemble data. It is to validate recommendations, assign owners, and escalate exceptions. The system handles the routine. The operator handles the judgment.
Most ecommerce brands reading this post are in Stage 2 or Stage 3. They have outgrown platform-native reporting. They have built spreadsheets or deployed BI. They still spend Monday mornings assembling data instead of deciding what to do about it. The transition to Stage 4 is not about buying software. It is about recognizing that the assembly problem is solved and the action problem remains.
How Fairview Applies Operating Intelligence to Ecommerce
Fairview is an operating intelligence platform built for operators who run multi-channel ecommerce brands. It is not a replacement for every BI use case. It is a layer that sits on top of connected data and closes the gap between insight and action.
The data foundation
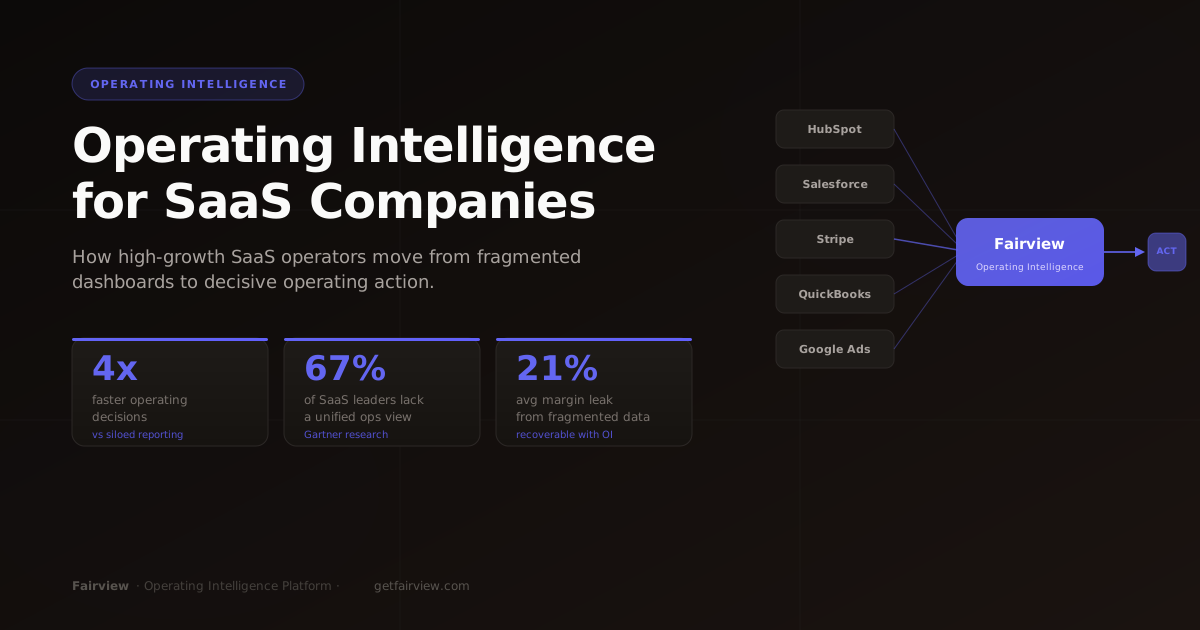
Fairview's Data Connection Layer connects to the tools ecommerce operators already use. Shopify for orders, inventory, and returns. Stripe for payments, refunds, and transaction fees. QuickBooks or Xero for COGS, overhead, and variable costs. Google Ads and Meta Ads for spend, impressions, and conversions. The first integration goes live in under 10 minutes. Data refreshes daily by default; real-time refresh is available on higher plans.
Normalization handles the definition conflicts that plague spreadsheet-based workflows. A customer in Shopify is matched to a contact in the CRM and a company in the accounting tool. Revenue is reconciled across GMV, net payment, and recognized revenue. SKU names are mapped across platforms. Duplicate records and field mismatches are resolved through a guided setup flow.
The operating view
The Operating Dashboard surfaces the metrics that matter to ecommerce operators: margin by channel, revenue vs. forecast, pipeline health, and anomaly alerts. It shows margin at the level that matters — by channel, by SKU, by campaign, by customer segment — and flags changes from the prior period automatically. No manual comparison required.
Margin intelligence
Fairview's margin layer pulls revenue data from Stripe and Shopify, cost data from QuickBooks and Xero, and applies attribution logic to allocate ad spend to revenue by channel. The result is profit per campaign, per channel, per SKU — not just total revenue. Companies using this feature recover an average of 23% of leaking margin in the first 90 days.
The accuracy note is important: margin intelligence requires a finance integration to calculate full contribution margin. Without it, Fairview shows revenue and channel performance — not complete margin. The operator must connect QuickBooks, Xero, or Stripe to unlock the full margin view.
Pipeline and forecast
For ecommerce brands with a B2B or wholesale channel, the Pipeline Health Monitor tracks deal progression and surfaces risk signals before deals fall through. The Forecast Confidence Engine produces a confidence-weighted revenue forecast with an optimistic-to-conservative range, not just a single number. It compares actual-to-forecast week over week to improve accuracy over time.
The action layer
The Next-Best Action Engine is the feature that most clearly separates Fairview from passive dashboards. When Fairview detects an anomaly — a margin drop on a specific channel, a cluster of returns on a specific SKU, a CAC spike on a specific audience — it generates a specific, named recommendation.
Examples of actions Fairview triggers for ecommerce operators:
- "Margin on paid search dropped 18% this week. Review Google Ads spend by campaign. Estimated weekly impact: $8K."
- "Return rate on SKU-2847 rose to 14% from 6%. Check product quality and customer feedback."
- "Meta CAC on Audience 25–34 Female increased 34% week over week. Consider pausing or refreshing creative."
- "Stripe data shows 3 accounts with repeat refunds this month. Check churn signals and initiate outreach."
The action is assigned, not left to inference. It appears in the dashboard and can be assigned to a team member with a due date.
The weekly rhythm
Fairview generates a structured Weekly Operating Report — sent to the operator's inbox every Monday morning. It summarizes the prior week: revenue vs. forecast, margin vs. prior period, channel-level changes, and open action items. It highlights the top 3 anomalies or risks detected that week. Operators arrive at their Monday review already briefed, not building.
The honest scope
Operating intelligence does not replace every BI use case. For deep exploratory analysis — custom queries, multi-dimensional drill-downs, ad hoc data science — a dedicated BI tool with a semantic layer is the right fit. Fairview is built for operators who need the data organized and the decision surface prepared, not for data teams building custom models.
Key Takeaways
- Ecommerce operators at multi-channel brands spend 8–15 hours per week on spreadsheet-based data assembly. The direct labor cost is $20,800–$39,000 per year at founder rates. The hidden cost is decisions deferred while data is being assembled.
- Ecommerce data is harder than it looks because revenue, cost, and attribution live in different systems with different definitions, different cadences, and different owners. The spreadsheet cannot synchronize them reliably at scale.
- Operating intelligence for ecommerce means four capabilities: automatic data connection and normalization, margin intelligence by channel and SKU, anomaly detection with priority ranking, and named recommendations — not generic alerts.
- Ecommerce brands move through five stages of data maturity: platform-native reporting, spreadsheet consolidation, BI dashboard deployment, operating intelligence adoption, and automated operating rhythm. Most brands reading this are in Stage 2 or 3.
- The transition signal is not revenue size. It is the ratio of time spent assembling data to time spent acting on it. When that ratio exceeds 3:1, the spreadsheet has become a bottleneck.
- Fairview connects Shopify, Stripe, QuickBooks, Xero, Google Ads, and Meta Ads into one operating view. It calculates contribution margin automatically, detects anomalies, and surfaces specific named actions. Companies recover an average of 23% of leaking margin in the first 90 days.
If your ecommerce brand is ready to move from spreadsheet reconciliation to automated profit tracking and named next actions, book a demo to see how Fairview connects your store, payment, accounting, and ad data into one operating view.
How much time do ecommerce operators spend on spreadsheets?
Ecommerce operators at brands with 100–500 SKUs across multiple channels spend 8–15 hours per week on spreadsheet-based data assembly, according to operational research from inventory management platforms. This includes pulling order data from each channel, updating stock counts manually, cross-referencing purchase orders, building reports for weekly meetings, and reconciling discrepancies when numbers do not match. At $50 per hour founder time, this costs $20,800–$39,000 annually in labor alone — before accounting for the opportunity cost of decisions deferred while data is being assembled.
What data sources does an ecommerce operating intelligence platform need?
An ecommerce operating intelligence platform needs four categories of data: e-commerce platform data (orders, SKUs, inventory, returns from Shopify or equivalent), payment processor data (revenue, refunds, transaction fees from Stripe or equivalent), accounting data (COGS, overhead, variable costs from QuickBooks or Xero), and advertising data (spend, impressions, conversions by campaign from Google Ads, Meta Ads, and other channels). The platform normalizes data across these sources, handles duplicate records and field mapping, and refreshes on a configurable cadence. Fairview connects to all four categories through its Data Connection Layer.
What is the difference between operating intelligence and business intelligence for ecommerce?
Business intelligence for ecommerce connects your data sources and presents metrics as dashboards and reports. It answers what happened: revenue by channel, conversion rate by landing page, average order value this month vs. last. Operating intelligence goes further. It monitors data continuously, detects when something meaningful changes, ranks the change by business impact, and surfaces a specific named recommendation. BI tells you that Meta ROAS dropped from 4.2 to 3.1. OI tells you that the drop is concentrated in two audiences, estimates the weekly revenue impact at $12K, and recommends pausing one audience and increasing budget on the other.
When should an ecommerce brand switch from spreadsheets to operating intelligence?
An ecommerce brand should switch from spreadsheets to operating intelligence when three signals appear together: manual reporting takes more than 4 hours per week, the brand sells across more than two channels or manages more than 50 SKUs, and weekly reviews are dominated by data presentation rather than decision-making. The trigger is not revenue size — it is the ratio of time spent assembling data to time spent acting on it. When that ratio exceeds 3:1, the spreadsheet has become a bottleneck, not a tool.