QUICK SUMMARY
Fairview and Tableau solve different problems. Tableau is a powerful data visualization platform for data teams with warehouses and technical resources. Fairview is an operating intelligence platform for revenue operators who need real-time revenue, margin, and pipeline intelligence without a data team. If you are comparing them for a revenue or RevOps use case, the answer is almost always Fairview — unless you already have a mature data infrastructure and a dedicated analytics team that can build and maintain Tableau workbooks.
What Each Tool Actually Does
Fairview
Fairview is an operating intelligence platform built for revenue and operations leaders. It connects your CRM, ad platforms, e-commerce or billing systems, and finance data into one unified view — and then continuously monitors that data to surface signals, anomalies, and insights proactively.
The defining characteristic: Fairview tells you what matters before you go looking. When CAC spikes anomalously, you get an alert. When your pipeline coverage drops below 3x quota, you get flagged. When margin on a specific channel or SKU degrades, the platform surfaces it — without anyone building a report or checking a dashboard.
Fairview requires no data team, no data warehouse, and no SQL. Setup takes 1–2 days via pre-built connectors.
Tableau
Tableau is a business intelligence visualization platform. It excels at taking data from a warehouse or database and rendering it into highly customizable charts, dashboards, and reports. It is among the most powerful tools in the world for data visualization and analysis — when operated by people with the technical skills to use it.
The defining characteristic: Tableau shows you what you build. A skilled Tableau developer can create any visualization imaginable. But the platform only answers the questions someone has already built a view for. It is reactive, not proactive. And it requires significant technical infrastructure to operate correctly.
Feature Comparison
| Feature | Fairview | Tableau |
|---|---|---|
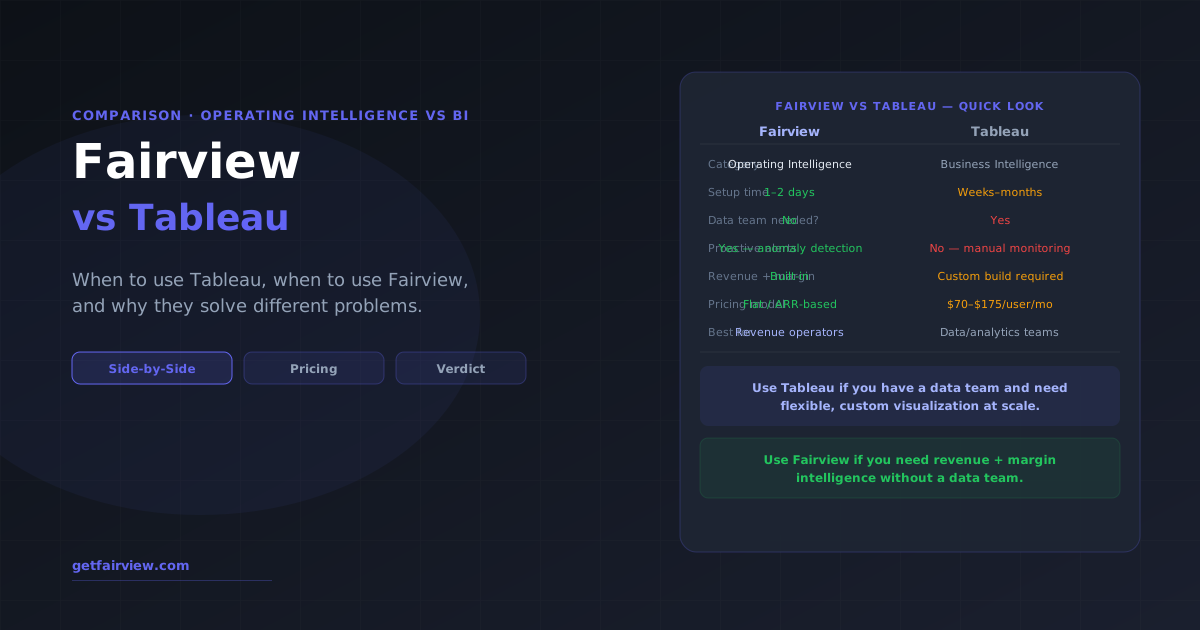
| Category | Operating Intelligence | Business Intelligence |
| Data freshness | Real-time (15-min sync) | Warehouse-dependent (often daily) |
| Proactive alerts | Yes — anomaly detection built-in | Basic threshold alerts only |
| Revenue + margin view | Built-in, pre-modeled | Custom build required |
| Natural language queries | Yes — ask in plain English | Limited (Tableau AI in development) |
| Data team required | No | Yes — for setup and maintenance |
| Data warehouse required | No — Fairview handles it | Yes (Snowflake, BigQuery, etc.) |
| Visualization flexibility | Revenue-focused presets | Unlimited — any chart type |
| Cross-functional use | Revenue and ops teams | Any team, any data type |
| Setup time | 1–2 days | Weeks to months |
Pricing Comparison
Tableau's pricing is user-based and complex. There are three license tiers:
- Tableau Viewer: $15/user/month — can view dashboards but not build them
- Tableau Explorer: $42/user/month — can create from existing data sources
- Tableau Creator: $70–$175/user/month — full access including desktop
But the license cost is not the full Tableau cost. A functional Tableau deployment also requires:
- A data warehouse (Snowflake: ~$300–$500/month; BigQuery: usage-based)
- ETL pipeline tooling (Fivetran: $500–$2,000/month; Airbyte: engineering time)
- A data engineer or analyst to build and maintain the infrastructure
- Tableau Server or Cloud hosting if you need to share dashboards across the org
For a small revenue team of 5–8 people with the necessary infrastructure, the realistic total Tableau cost runs $4,000–$10,000/month when you include infrastructure and the portion of a data engineer's time dedicated to maintaining the stack.
Fairview is priced as a flat subscription that includes all connectors, infrastructure, and the operating intelligence layer. The cost comparison is not Fairview vs Tableau — it is Fairview vs Tableau plus everything required to make Tableau work.
See Fairview pricing without the infrastructure cost.
All connectors, real-time sync, and anomaly detection included. No data team needed.
View pricing →Setup and Ongoing Maintenance
The setup gap between Fairview and Tableau is significant, and it compounds over time.
Fairview Setup
Fairview connects via pre-built OAuth integrations to the most common business systems (Salesforce, HubSpot, Shopify, Stripe, Google Ads, Meta, QuickBooks, and others). Connecting a data source takes 2–5 minutes per integration. The initial revenue and margin dashboard is pre-configured — you personalize thresholds and alert rules. Typical time from signup to first live insight: 1 business day.
Tableau Setup
Tableau requires a data foundation before it can do anything useful. This means: setting up a data warehouse, building ETL pipelines to move data from each source into the warehouse, transforming the data into a clean, queryable schema (usually via dbt), and then building Tableau workbooks that connect to the warehouse. For a company with 5 data sources, a realistic setup timeline is 6–12 weeks of a data engineer's time before the first meaningful dashboard is live.
Ongoing maintenance is also substantially higher for Tableau. Every time a source system changes its API, the pipeline breaks. Every time a new data source is added, a new ETL pipeline must be built. Every time a business user wants a new metric, someone with Tableau skills has to build the view. These are legitimate costs that rarely appear in Tableau pricing comparisons.
When to Use Fairview vs When to Use Tableau
Choose Fairview when:
- You are a revenue, RevOps, or growth operator who needs real-time intelligence on revenue, margin, and pipeline
- You do not have a dedicated data team or data warehouse
- You want proactive alerts — you want to be told when something breaks, not find it when you go look
- You need to unify CRM, ads, and finance data without custom development
- Time to first insight matters — you need answers in days, not months
Choose Tableau when:
- You have a dedicated data team with Tableau skills
- You already have a data warehouse in production
- You need flexible, custom visualizations across many different data types and business functions
- Your analytics needs span multiple departments beyond revenue (HR, supply chain, finance modeling)
- You need embeddable analytics in external products or portals
The Verdict
Tableau and Fairview are not direct competitors in the traditional sense — they are built for different buyers and different problems. A company asking "should we use Fairview or Tableau for our revenue intelligence?" is asking the right question for the wrong comparison.
The better questions: Do you have a data team? Do you have a warehouse? Do you need custom visualization across all business functions, or do you need revenue and margin intelligence specifically? Do you need proactive alerts, or do you need a tool that shows you what you build?
If you answered "no data team, no warehouse, need revenue/margin intelligence, need proactive alerts" — Fairview is the right choice by a significant margin, both on capabilities and total cost. If you answered "mature data team, warehouse in production, need cross-functional analytics flexibility" — Tableau is a better fit, and Fairview may complement it for the revenue team's day-to-day intelligence needs.
Many companies end up using both: Tableau for the analytics team's exploratory work and long-form reporting, and Fairview for the revenue team's operating cadence. They serve different needs and different users.
Tableau has self-service features, but getting meaningful value typically requires a data team to set up the underlying data model, build reusable views, and maintain integrations. Non-technical users can use pre-built Tableau dashboards, but creating new analyses usually requires Tableau Desktop skills and SQL access to the underlying data warehouse.
Choose Tableau if you have a mature data team, a data warehouse already in production, and need flexible custom visualization across any data type and domain. Tableau is the right choice for analytics teams building reports for many business functions. Fairview is the right choice for revenue teams that need operating intelligence — revenue, margin, and pipeline visibility — without the infrastructure investment.
See Fairview with your revenue data
Connect your CRM and ad data in one session — live insights, no setup required.
Book a demo →Founder of Fairview. I built Fairview because I kept watching revenue operators make decisions from stale spreadsheets while paying for BI tools they needed a data team to use.
More Comparisons
Fairview vs Power BI
How Fairview compares to Microsoft's BI platform.
ExplainerOperating Intelligence vs Business Intelligence
The full breakdown of OI vs BI.
GuideOI Platform: Complete Evaluation Guide
7 must-have features and a buying framework.
GuideBusiness Intelligence in 2026: Non-Technical Guide
BI explained in plain English.