QUICK SUMMARY
Power BI is the best value business intelligence tool in the Microsoft ecosystem. Fairview is an operating intelligence platform built specifically for revenue operators who need real-time, unified revenue and margin intelligence. Power BI wins on price per seat and breadth if you are already Microsoft-heavy. Fairview wins on setup speed, revenue-specific features, proactive anomaly detection, and not requiring a data team or DAX expertise.
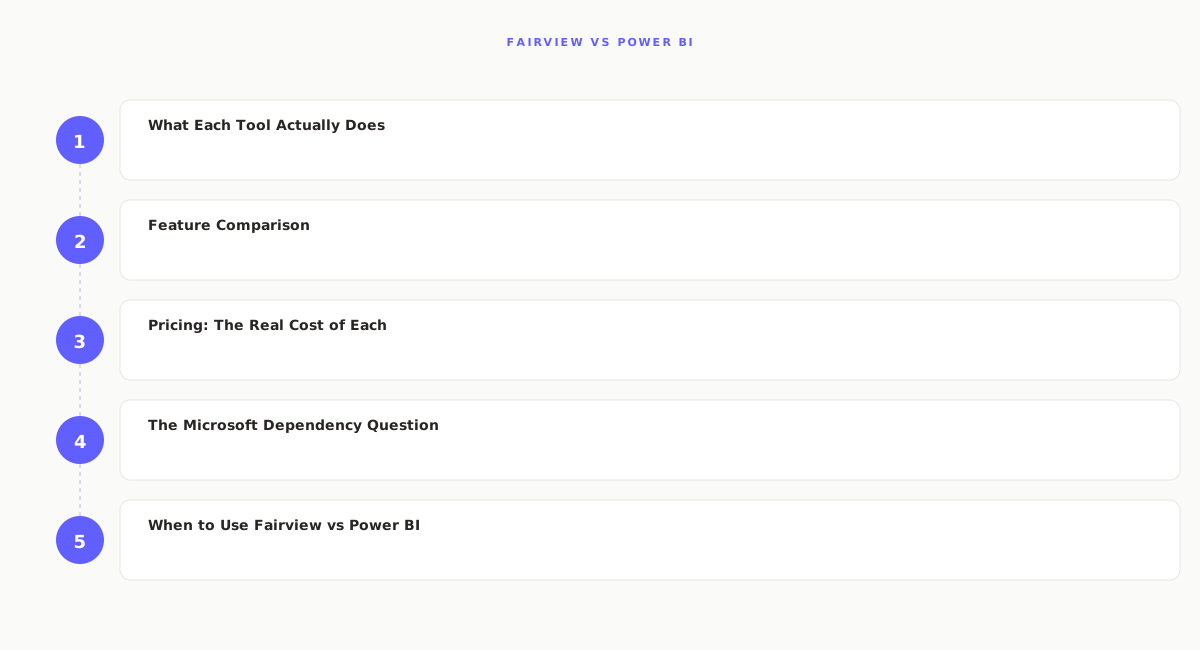
What Each Tool Actually Does
Fairview
Fairview is an operating intelligence platform designed for revenue and operations leaders. It connects CRM, ad platforms, billing, and finance data into a unified model — then monitors it continuously and surfaces anomalies, risk signals, and performance gaps before you go looking.
The result: a CRO or operator can open Fairview on Monday morning and immediately see revenue vs target, pipeline coverage, CAC trend, and margin by channel — all current, all unified, with any anomalies flagged automatically. No report-building, no SQL, no analyst queue.
Power BI
Power BI is Microsoft's business intelligence platform. It is a strong tool for data visualization and reporting — particularly for organizations already using Microsoft 365, Azure, and Excel. Power BI Desktop (free) lets analysts build complex dashboards using DAX formulas and Power Query data transformations. Power BI Service (paid) allows those dashboards to be shared across an organization.
Power BI can connect to almost any data source, but the work of building meaningful revenue and margin models requires a data analyst with DAX knowledge, and the sharing infrastructure requires Pro or Premium licenses.
Feature Comparison
| Feature | Fairview | Power BI |
|---|---|---|
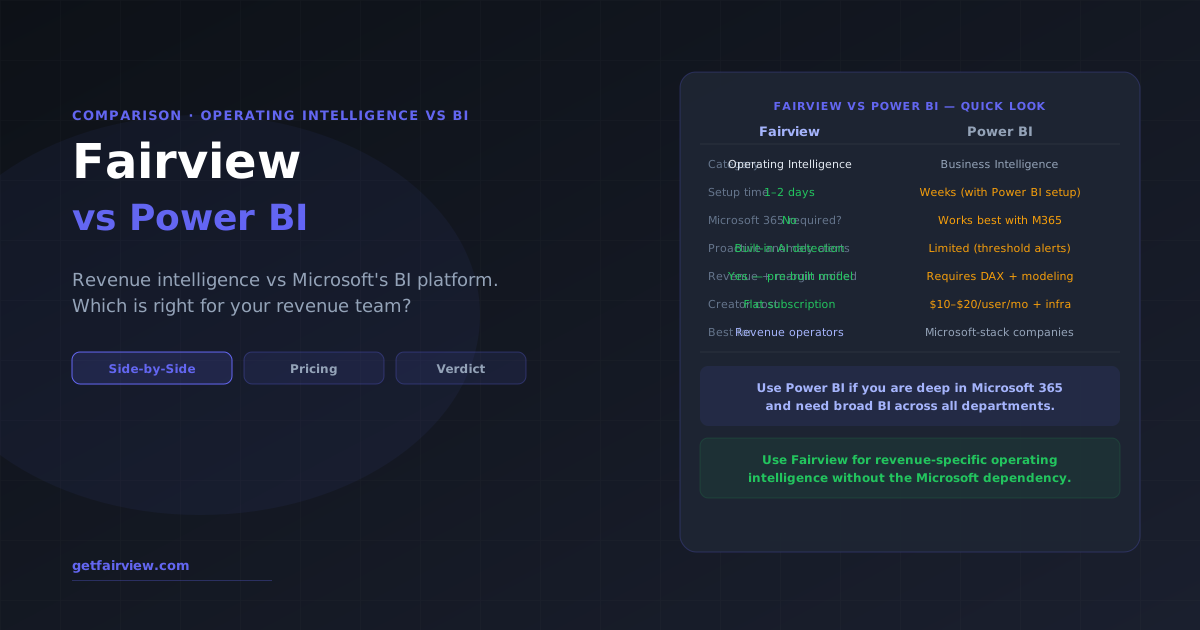
| Category | Operating Intelligence | Business Intelligence |
| Data freshness | Real-time (<15 min sync) | Up to 8 refreshes/day on Pro |
| Anomaly detection | Built-in AI anomaly detection | Basic AI Insights (limited) |
| Revenue + margin unified | Pre-built model, no setup | Requires DAX modeling |
| Natural language queries | Full NL query interface | Q&A feature (limited) |
| Data team needed | No | Yes — for DAX + data modeling |
| Microsoft dependency | None | Works best with M365/Azure |
| Setup time | 1–2 days | Weeks (data modeling required) |
| Price per seat | Flat subscription | $10–$20/user/month |
| Visualization flexibility | Revenue-optimized views | Highly flexible, custom visuals |
Pricing: The Real Cost of Each
Power BI Pricing
Power BI's pricing looks attractive on paper. But the sticker price understates the real cost:
- Power BI Desktop: Free — but only for individual use. Cannot share across teams.
- Power BI Pro: $10/user/month — required for organizational sharing. Includes up to 8 daily dataset refreshes.
- Power BI Premium Per User: $20/user/month — larger datasets, more refreshes, AI features, paginated reports.
- Power BI Premium (capacity): $5,000+/month — enterprise deployments with embedded analytics.
The hidden costs: an analyst's time to build and maintain DAX models (often $80,000–$120,000/year in fully loaded cost), data infrastructure if not already on Azure, and the ongoing maintenance burden when source systems change.
Fairview Pricing
Fairview is priced as a flat subscription that includes all connectors, infrastructure, and the intelligence layer. There are no per-seat licensing fees for data viewers, no separate warehouse costs, and no professional services required for setup. See Fairview pricing for current rates.
The key cost comparison: Power BI at $10/user/month sounds cheap. But if you add even 0.25 of an analyst's FTE to build and maintain the data model, the effective cost of meaningful Power BI analytics typically exceeds $4,000–$6,000/month for a small revenue team.
Get revenue intelligence without the DAX learning curve.
Fairview connects your CRM, ads, and finance data — pre-built revenue and margin model included.
See how it works →The Microsoft Dependency Question
Power BI's biggest selling point is also its biggest limitation: it is tightly integrated with the Microsoft ecosystem. If your company uses Azure AD, Teams, SharePoint, and Excel heavily, Power BI flows naturally into your existing workflow. Reports can be embedded in Teams. Data can pull from Azure SQL or Azure Data Lake. Access management uses the same Azure AD groups as everything else.
If you are not Microsoft-heavy, Power BI is a reasonable tool that works, but you lose the ecosystem integration advantages and introduce a dependency on a platform that is built to push you toward the Microsoft stack over time.
Fairview has no ecosystem dependency. It connects to Salesforce, HubSpot, Pipedrive, Google Ads, Meta, Shopify, Stripe, QuickBooks, and others via OAuth — regardless of what cloud platform or productivity suite you use.
When to Use Fairview vs Power BI
Choose Fairview when:
- You need unified revenue + margin + pipeline intelligence without building a data model
- You do not have a DAX-skilled analyst or data engineer on the team
- You want proactive anomaly alerts rather than manually checking dashboards
- You need real-time data sync (not 8x daily refreshes)
- Your stack is not Microsoft-centric
Choose Power BI when:
- You are deeply embedded in Microsoft 365 and Azure
- You have an analyst with DAX and Power Query skills
- You need broad analytics across HR, finance, supply chain, and revenue in one platform
- Per-seat cost is a primary constraint and the analyst cost is already budgeted
- You need to share reports with large numbers of view-only users at low cost
The Verdict
For revenue teams specifically — CROs, RevOps leads, VPs of Marketing, growth operators — Fairview wins on nearly every dimension that matters for their day-to-day work: real-time data, unified revenue and margin model, proactive anomaly detection, and zero data team requirement.
Power BI is the right choice for companies that need a broad BI platform across all business functions and are already invested in the Microsoft ecosystem. It is the most cost-effective entry-level BI tool if you have an analyst who can run it.
Many mature companies end up using both: Power BI for company-wide reporting across HR, finance, and operations, and Fairview for the revenue team's operating intelligence cadence. The two serve different audiences with different needs, and they do not overlap significantly in practice.
Power BI Desktop is free for individual use, but it cannot share reports across an organization. The Pro license costs $10/user/month and supports organizational sharing with up to 8 daily refreshes. Premium Per User is $20/user/month. Enterprise Premium is capacity-based starting around $5,000/month. The free tier is not sufficient for team use.
Power BI works without Microsoft 365, but it integrates most naturally with the Microsoft ecosystem. Power BI Service requires an organizational account. Companies already using Azure, Teams, SharePoint, and Excel get the most value. Non-Microsoft companies can use it but lose key integration benefits and may face friction with authentication and data source connectivity.
Choose Fairview when you need real-time revenue and margin intelligence without a data team, proactive anomaly detection instead of manual dashboard checking, unified CRM + ads + finance data out of the box, and quick setup (days not weeks). Choose Power BI when you are deeply in Microsoft 365, have a DAX-skilled analyst, and need broad analytics across multiple departments beyond revenue.
See operating intelligence vs Power BI dashboards
Book a demo to see how Fairview surfaces revenue and margin signals your Power BI dashboard does not catch automatically.
Book a demo →Founder of Fairview. Built for revenue operators who need intelligence before the weekly meeting, not a BI tool their data team has to configure.
More Comparisons
Fairview vs Tableau
How Fairview compares to Tableau for revenue teams.
GuideOI Platform: Complete Guide
7 must-have features for an operating intelligence platform.
RevOpsRevOps Tech Stack 2026
Where BI and OI fit in the modern revenue stack.
GuideBusiness Intelligence in 2026
Plain English guide to BI for non-technical operators.