TL;DR
D2C brands lose margin when they scale because CAC increases faster than order values, discounts compound, and unprofitable channels go undetected. The fix is treating contribution margin by channel as the primary growth metric and building six operational disciplines around it: channel margin visibility, CAC ceilings, LTV expansion, SKU profitability analysis, discount discipline, and return economics.
Why D2C Margins Compress as You Scale
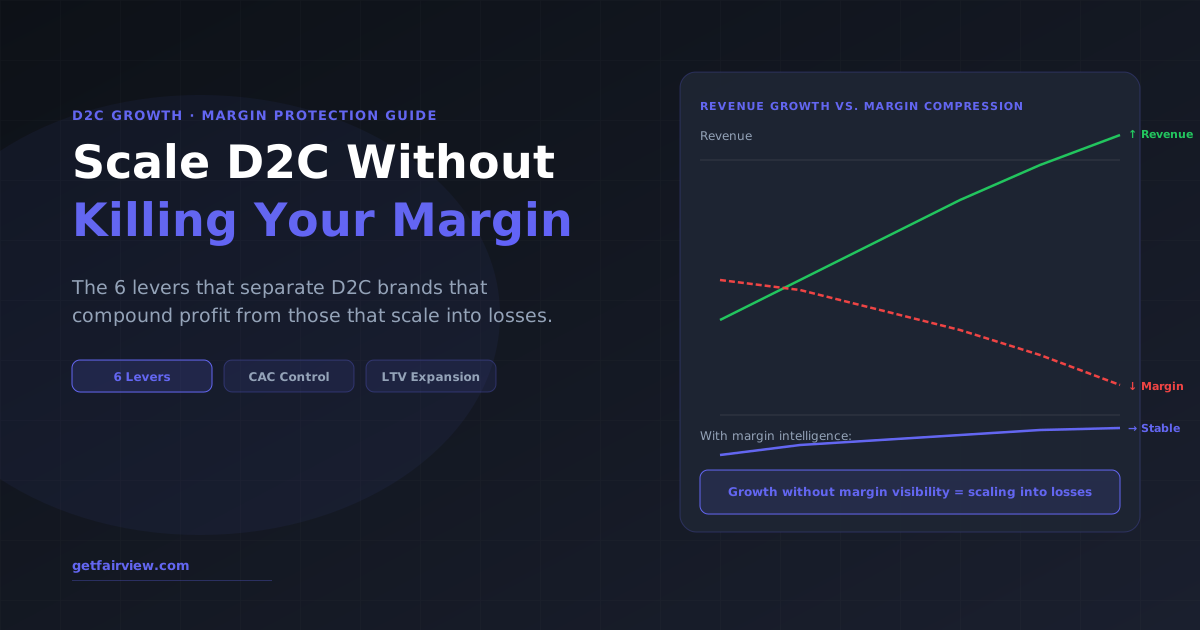
The pattern is consistent. A D2C brand finds product-market fit with strong unit economics — 35% contribution margin, 3x ROAS on paid social, solid LTV. They raise capital, scale spend, and 18 months later are doing 5x the revenue with 12% contribution margin. The CFO calls it margin compression. The CMO calls it channel saturation. The founder calls it a profitability crisis.
The causes are predictable:
- CAC creep. Early paid social campaigns target a high-intent core audience at $25–35 CAC. Scaling requires moving to lookalike audiences and broader targeting where CPMs are higher and conversion rates lower — pushing CAC to $60–90 without a corresponding increase in average order value.
- Discount escalation. To hit revenue targets, the brand runs more promotions. Each promotion looks successful on a revenue basis. Each one compresses contribution margin by 8–15 percentage points per event.
- Channel blindness. The brand knows total ROAS but not contribution margin by channel. Affiliate programs running at -3% contribution margin appear profitable in ROAS terms. Paid search with 2.5x ROAS but 42% COGS is losing money on every sale.
- Return rate normalization. Returns are counted as revenue adjustments but rarely factored into channel-level profitability. A fashion category with 35% return rates has a very different contribution margin than the pre-return ROAS suggests.
The good news: every one of these is fixable. The fix requires visibility into contribution margin at the channel and SKU level — and the discipline to act on what you see.
Lever 1: Build a Contribution Margin View by Channel
See profit by channel, not just ROAS
ROAS measures revenue per ad dollar. Contribution margin measures profit per ad dollar. They often tell opposite stories.
The formula for channel contribution margin:
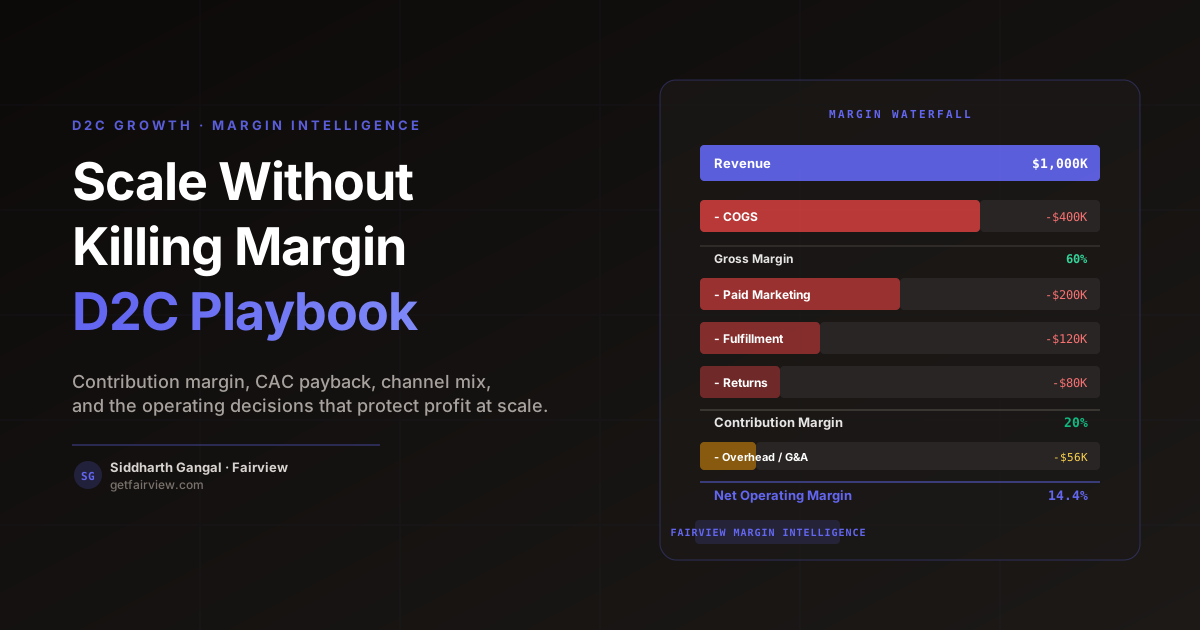
Channel CM = (Revenue − COGS − Channel Ad Spend − Allocated Shipping − Payment Fees − Returns) ÷ Revenue
Calculate this for every paid channel — Google, Meta, TikTok, affiliates, influencers — separately. The output typically reveals that 1–2 channels are generating all the margin while 1–2 others are net-negative. Most brands run at least one negative-contribution channel without knowing it.
Once you have the view: set a contribution margin floor per channel. If a channel drops below 20% contribution margin, it triggers a review. Below 10%, it triggers a pause-and-audit. This replaces reactive decision-making ("ROAS is down, increase bids") with proactive margin management.
The detailed methodology for this calculation is covered in the contribution margin by channel guide — including how to allocate shared costs like shipping and fulfillment across channels.
Lever 2: Set a CAC Ceiling Based on Contribution Margin
CAC without a contribution margin ceiling is unconstrained spending
Most brands set CAC targets based on payback period. The better constraint is contribution margin per order.
The maximum defensible CAC for a given channel is:
Max CAC = (Average Order Value × Target Contribution Margin) − Non-Acquisition Variable Costs
Example: AOV of $85, target contribution margin of 25%, COGS of $28, shipping of $8, payment fees of $2.50. Max CAC = ($85 × 0.25) − ($28 + $8 + $2.50) = $21.25 − $38.50 = -$17.25. This brand cannot profitably acquire a customer on first purchase at any positive CAC with these economics. It needs either higher AOV, lower variable costs, or a repeat purchase model to justify customer acquisition spend.
Most D2C brands do not run this calculation. They look at ROAS and adjust bids. The CAC ceiling forces the right conversation: if acquiring a customer on this channel at acceptable economics is impossible, the answer is not to increase ad spend — it is to fix the unit economics or find a different channel.
Lever 3: Expand LTV to Justify CAC
First-order economics are a constraint, not the model
If your brand has strong repeat purchase behavior, first-order margin can be subsidized by LTV — but this must be intentional, not accidental.
LTV expansion levers for D2C brands:
- Subscription conversion. Converting one-time buyers to subscribers at even a 20% rate dramatically improves LTV:CAC. Subscription orders are typically higher-margin because acquisition costs are zero on repeat purchases.
- Post-purchase email sequences. A well-built post-purchase sequence that drives a second purchase within 60 days of the first is the highest-ROI retention investment most D2C brands can make. The second purchase has near-zero acquisition cost.
- Bundle and upsell optimization. Increasing average order value on the first purchase is the most direct way to improve first-order contribution margin without reducing CAC.
- Cohort-based LTV tracking. Not all customer cohorts have the same LTV. Customers acquired through certain channels or certain product entry points have measurably higher LTV. Shifting acquisition budget toward high-LTV cohorts improves long-term economics without changing first-order margin.
Lever 4: Audit SKU Profitability
Not all SKUs deserve marketing budget
Promoting a low-margin SKU at scale is worse than not promoting it at all. SKU-level contribution margin determines which products deserve paid acquisition.
Run a SKU-level contribution margin analysis quarterly. For each product, calculate:
| Metric | Include? |
|---|---|
| Revenue per unit | Yes |
| COGS per unit | Yes |
| Allocated shipping cost | Yes |
| Return rate × return handling cost | Yes — often excluded |
| Payment processing fees | Yes |
| Allocated paid media if SKU is featured | Yes |
The result: a ranked list of SKUs by contribution margin. The highest-margin SKUs deserve the most paid acquisition budget. The lowest-margin SKUs should not be featured in paid campaigns — they generate revenue but destroy margin at scale.
Lever 5: Build Discount Discipline Into the Operating Rhythm
Discounts are the fastest way to destroy contribution margin
A 20% discount on a product with 30% contribution margin cuts margin by two-thirds. Most brands run promotions without calculating this.
The margin impact of a discount:
Post-discount CM = (Revenue × (1 − Discount%)) − COGS − Variable Costs
Example: A product with $100 revenue, $40 COGS, $25 variable costs, and 35% contribution margin. After a 20% discount: Revenue = $80, CM = $80 − $40 − $25 = $15 (18.75% margin). The 20% discount cuts contribution margin nearly in half.
Discount discipline means:
- Requiring a contribution margin model for any promotion before it runs
- Setting a minimum post-discount contribution margin (e.g., never below 15%)
- Tracking whether promotions drive net-new customers or primarily pull forward purchases from existing customers (which has zero CAC benefit)
- Limiting the frequency of full-site discounts that train customers to wait for sales
Lever 6: Factor Return Economics Into Channel Decisions
Returns are not a logistics problem — they are a margin problem
Excluding return costs from channel profitability analysis produces systematically overstated contribution margins for high-return categories.
Return costs per order include: inbound shipping, quality inspection, restocking labor, re-packaging if needed, and disposition cost for items that cannot be resold. For a fashion brand with 30% return rates, these costs can add $8–15 per order to the cost base.
Return rates also vary by channel — customers acquired through influencer marketing or broad social targeting often have higher return rates than customers who found the brand through search intent. Including return costs in channel contribution margin analysis reveals whether "high-volume" channels are actually profitable net of returns.
The D2C Margin Dashboard: What to Track Weekly
| Metric | Frequency | Why It Matters |
|---|---|---|
| Contribution margin by channel | Weekly | Primary signal for where to grow vs. cut spend |
| CAC vs. CM floor by channel | Weekly | Alerts when CAC exceeds the profitable acquisition ceiling |
| ROAS vs. contribution-adjusted ROAS | Weekly | Shows gap between reported and actual channel performance |
| Return rate by channel and SKU | Monthly | Identifies high-return channels that overstate profitability |
| Repeat purchase rate (30/60/90 day) | Monthly | Leading indicator of LTV and whether CAC is justified |
| Blended contribution margin | Weekly | Top-line health signal — should be stable or improving |
How Fairview Keeps D2C Margins Visible
Fairview's Margin Intelligence module connects your Shopify or billing data, accounting software (QuickBooks or Xero for COGS), and ad platforms (Google Ads, Meta Ads) to compute contribution margin by channel automatically — updated weekly.
The weekly operating report surfaces:
- Contribution margin by channel versus the prior week and 4-week average
- CAC by channel versus the maximum profitable CAC calculated from your unit economics
- SKU-level margin for the top 20 products
- Automated alert when any channel drops below the contribution margin floor
The practical outcome: the team stops flying blind on paid spend. Every budget conversation is grounded in contribution margin data, not ROAS. The operators who use this view consistently find at least one channel or SKU combination that is net-negative — and cutting it immediately improves blended margin without reducing revenue materially.
See margin by channel — live
Fairview for D2C Operators
Connect Shopify, your ad platforms, and QuickBooks. Get contribution margin by channel every week — automatically.
The Profitability Review Cadence
Scaling without killing margin is not a one-time exercise. It is an operating discipline. The brands that maintain healthy margins through growth run a consistent profitability review cadence — not a quarterly finance meeting, but a weekly operating check that surfaces margin data before it becomes a crisis.
A practical profitability review cadence runs at three levels:
- Weekly: Review contribution margin by channel. Look for week-over-week changes greater than 3 percentage points. If paid social margin dropped from 24% to 19% in one week, investigate before spending another $50K.
- Monthly: Review contribution margin by SKU. Update your SKU ranking. Identify products that have moved into unprofitable territory and those that have improved. Make sourcing and pricing decisions accordingly.
- Quarterly: Review customer cohort margin. Calculate average order contribution margin by cohort acquisition channel. Confirm that the channels generating the most customers are generating the most profitable ones.
This cadence does not require a dedicated analyst. It requires connected data and a clear reporting format. Fairview's Weekly Operating Report surfaces channel contribution margin automatically each week, so the decision-makers have the number before Monday's review meeting — not after a manual pull that takes three hours. For a template on building this rhythm, see our weekly operating cadence checklist.
What Healthy D2C Margin Looks Like at Scale
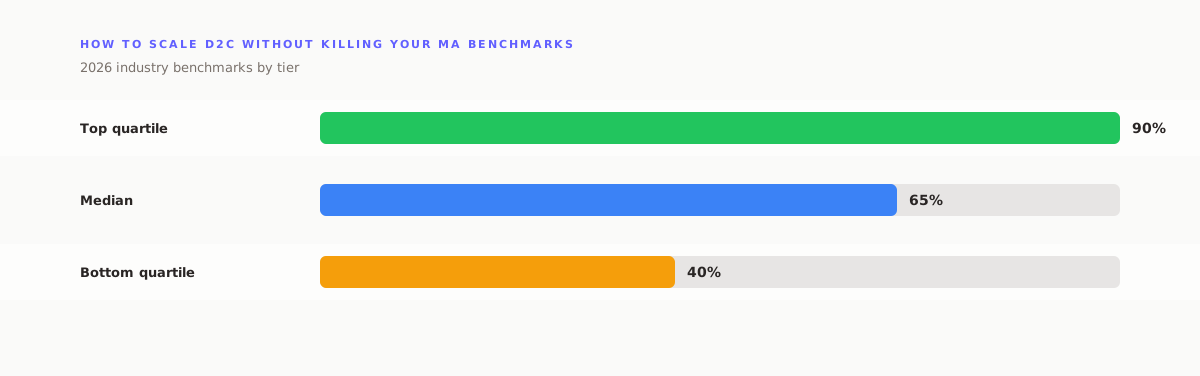
The target benchmarks shift as revenue grows. Early-stage D2C brands ($1M–$5M ARR) can sometimes operate at contribution margins below 20% if they are investing in brand and channel diversification. At $10M+ ARR, the math changes: a business growing fast on thin contribution margins will require ever-larger capital infusions to sustain that growth, and at some threshold, the capital cost exceeds the margin generated.
Benchmarks for healthy D2C contribution margin by stage:
- Under $5M revenue: 15–25% acceptable if channels are diversifying and LTV is improving
- $5M–$20M revenue: 22–32% target; channels are maturing and paid efficiency should be improving
- $20M+ revenue: 28–40% floor; at scale, contribution margin inefficiency compounds into a structural problem
These are benchmarks, not rules. A brand with strong owned-channel economics, high repeat purchase rates, and low return rates can sustain profitability at lower gross margins. The key is that the trajectory is moving in the right direction — contribution margin should improve or hold steady as revenue scales. If it is deteriorating as revenue grows, the brand is acquiring growth at the expense of unit economics. That path has a ceiling.
Key Takeaways
- D2C margins compress as brands scale because CAC increases faster than order values and unprofitable channels go undetected
- The six margin levers: channel contribution view, CAC ceiling, LTV expansion, SKU profitability, discount discipline, and return economics
- ROAS is not a margin metric — optimize for contribution margin, not revenue per ad dollar
- Set a contribution margin floor (minimum 15–20%) below which any channel triggers a review or pause
- Healthy D2C contribution margin is 25–40%; below 15% means the business cannot profitably scale paid acquisition
- Run a weekly channel margin review, monthly SKU review, and quarterly cohort review to catch margin erosion before it compounds
What is a healthy contribution margin for a D2C brand?
A healthy contribution margin for a D2C physical goods brand is 25–40%. Below 15% is a warning zone where the business cannot profitably scale marketing spend. Above 40% creates runway for growth investment. Subscription D2C brands typically target 20–35% contribution margin on first-order economics, with the model depending on LTV to justify the initial customer acquisition cost.
How do you calculate contribution margin for a D2C product?
D2C contribution margin = Revenue − COGS − Ad spend (fully allocated to the channel) − Shipping and fulfillment costs − Payment processing fees − Returns cost. The result expressed as a percentage of revenue is your contribution margin. The most common mistake is excluding shipping and returns, which overstates channel profitability significantly for high-return-rate categories like fashion or footwear.
What is the biggest mistake D2C brands make when scaling?
The biggest scaling mistake is optimizing for ROAS instead of contribution margin. ROAS measures revenue per ad dollar but ignores COGS, shipping, and commissions. A channel with 4x ROAS and 40% COGS plus 25% variable costs generates only 15% contribution margin — barely break-even at scale. Brands that optimize for ROAS while margins compress are scaling into losses without understanding why their financials are deteriorating.
Siddharth Gangal
Founder, Fairview. Writes about D2C profitability, margin intelligence, and the operating systems that separate growing brands from profitable ones.
LinkedIn →