

TL;DR
- The LTV:CAC ratio divides customer lifetime value by acquisition cost. 3:1 is the minimum sustainable threshold for B2B SaaS.
- Churn reduction is the single highest-impact lever — halving churn doubles LTV at the same revenue per customer.
- Blended ratios hide channel-level destruction. Segment by acquisition source before deciding where to invest.
- LTV must use gross margin, not top-line revenue — otherwise the number is flattering but misleading.
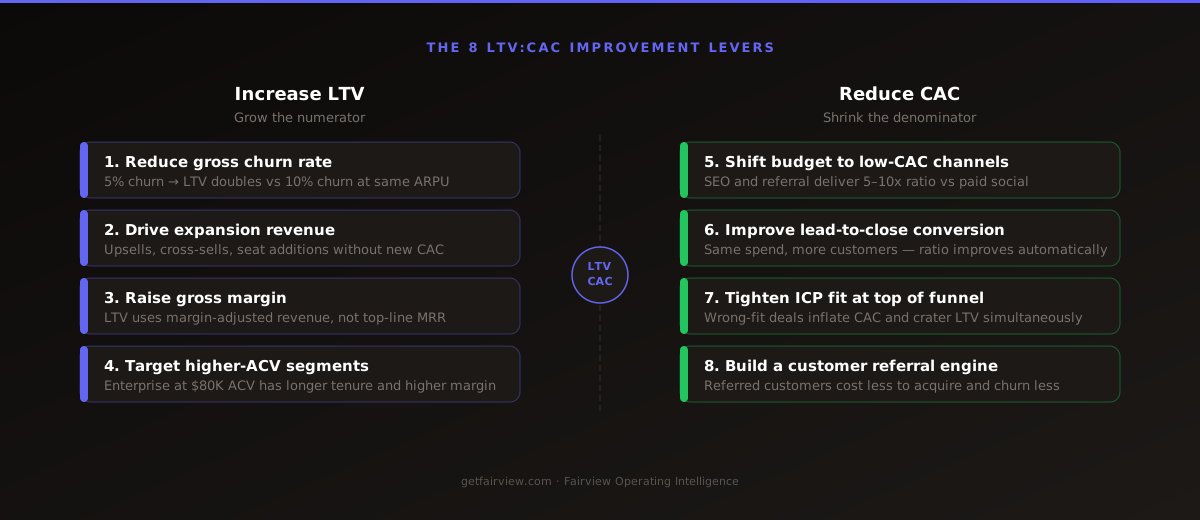
- Eight levers exist: four raise LTV, four cut CAC. Most businesses only work 2 of them at a time.
What the LTV:CAC Ratio Actually Measures
The LTV:CAC ratio is the most direct measure of whether your business model works at scale. It answers one question: for every dollar spent acquiring a customer, how many dollars does that customer return over their lifetime?
A 3:1 ratio means each customer returns $3 in margin for every $1 spent to acquire them. A 1:1 ratio means you break even — no margin left for operations, R&D, or profit. Below 1:1, the business destroys value with every sale.
The ratio connects two operating levers that most teams manage separately. Sales and marketing own CAC. Customer success and product own LTV. When these teams operate in silos, the ratio drifts without anyone noticing — until a board meeting or a fundraising conversation makes the number visible.
Tracking the LTV:CAC ratio forces cross-functional alignment. It creates a single number that captures the health of your entire revenue model — from first marketing touch to final churn date.
The LTV:CAC Formula — and the Calculation Errors That Inflate It
Most teams calculate LTV:CAC incorrectly. The errors are systematic and almost always make the number look better than it is.
The Correct LTV Formula
LTV = (ARPU × Gross Margin %) ÷ Monthly Churn Rate
Where ARPU is average monthly revenue per customer, gross margin percentage removes cost of goods sold from the numerator, and churn rate is the percentage of customers or revenue lost per month.
The Correct CAC Formula
CAC = Total Sales and Marketing Spend ÷ New Customers Acquired
Total spend must include salaries, commissions, employer taxes, ad spend, agency fees, tool subscriptions, and any contractor costs — for the same period used to count new customers.
The 4 Errors That Inflate Your Number
- Using revenue instead of gross margin in LTV. If your gross margin is 70%, the real LTV is 70% of the number you calculated with top-line revenue. The gap matters when deciding how much to spend on acquisition.
- Omitting full sales costs from CAC. Ad spend only is not CAC. A company with 3 full-time sales reps and $50K in ads has a CAC problem hiding in salaries. Include everything: headcount, tools, travel, and partner fees.
- Averaging churn across segments. Enterprise customers churn at 2% per year. SMB customers churn at 35%. A blended churn rate of 18% produces a blended LTV that is misleading for every segment individually.
- Using bookings instead of recognized revenue. A $120K annual contract signed in December inflates December CAC calculations if you count the full booking. Use monthly recognized revenue to match the period correctly.
Fixing these 4 errors typically reduces the calculated LTV:CAC by 15–30% from the version most teams present to the board. The correct number is lower — but it is the number worth improving.
LTV:CAC Benchmarks by Company Stage — 2026
The right target depends on your ARR stage, go-to-market motion, and gross margin profile. These are 2026 medians across B2B SaaS companies.
| Company Stage | ARR Range | Median Ratio | Top Quartile | CAC Payback |
|---|---|---|---|---|
| Early Stage | Under $2M | 2.5:1 | 3.5:1 | 120 days |
| Growth Stage | $2M – $10M | 3.2:1 | 4.5:1 | 90 days |
| Scale Stage | $10M – $50M | 3.8:1 | 5.5:1 | 80 days |
| Enterprise | $50M+ | 4.5:1 | 6.0:1+ | 65 days |
By vertical, Cybersecurity companies average 4.2:1 because of high switching costs and long contract tenure. HR Tech averages 3.5:1. SMB-focused SaaS companies often sit at 2.5–3.0:1 because high churn compresses LTV regardless of acquisition efficiency.
A ratio above 10:1 is not automatically a sign of health. It often signals that you are under-deploying on acquisition and leaving growth on the table. Investors interpret a persistently high ratio as a missed opportunity — not fiscal discipline.
Why Your Blended LTV:CAC Ratio Is Hiding the Real Problem
A company with a blended 3:1 LTV:CAC ratio can simultaneously have one channel destroying value and another printing it.
Organic search typically delivers 5–10x LTV:CAC ratios once content compounds. Referral programs deliver 6–10x because referred customers arrive pre-qualified and churn less. Paid social, by contrast, frequently runs at 0.8:1 to 1.5:1 — below the minimum threshold — because acquisition costs are high and customer quality is lower.
When you blend these, a 3:1 average can coexist with active value destruction. The fix requires segmenting LTV:CAC by acquisition source, by customer segment, and by cohort quarter. The problem almost always lives inside one or two channels — not evenly distributed across the business.
Track the ratio by channel alongside marketing channel ROI to see the full picture. The two metrics together reveal where to reallocate and where to cut.
Lever 1: Reduce Gross Churn Rate
Churn reduction is the highest-impact move available to most SaaS businesses. Churn sits in the denominator of the LTV formula. Small improvements produce disproportionately large gains.
At a 10% annual churn rate and $10K ARPU with 75% gross margin, LTV is approximately $75K. Reduce churn to 5% annual — LTV doubles to $150K. Nothing else changed: same revenue per customer, same margin, same acquisition cost. The ratio moved from 3:1 to 6:1 on that lever alone.
Where Churn Actually Comes From
Most churn is visible before it happens. The leading indicators are: low product usage in months 2 and 3 post-onboarding, absence of an internal champion at the customer, contract renewal dates with no CS touchpoints scheduled, and declining engagement with the product's core workflow.
Building a customer health score that aggregates these signals is the foundation of a churn reduction program. Without it, CS teams work reactively — catching cancellations after the decision is made, not before.
The 4 Highest-Impact Churn Reduction Actions
- Fix the onboarding gap. The majority of eventual churners show low engagement in the first 30 days. Structured onboarding — milestone-based, not time-based — closes this gap. Every customer needs to reach their first "value moment" within 14 days or the churn probability rises sharply.
- Install early-warning alerts. Set automated triggers when usage drops below a threshold for 7 consecutive days. CS contacts the account before the customer decides to leave — not after they submit the cancellation request.
- Identify and cultivate internal champions. Accounts without an identified internal champion churn at 2–3x the rate of accounts where one person owns the relationship and advocates internally for the product. Map champion status for every account above a revenue threshold.
- Conduct structured save conversations. When a customer signals intent to leave, a scripted save conversation with a clear value audit identifies whether the problem is solvable. Companies that run formal save programs recover 15–25% of at-risk revenue that would otherwise leave.
Track net dollar retention alongside gross churn. NDR above 100% means expansion from existing accounts outpaces losses — even with some churn, the LTV baseline keeps growing.
Lever 2: Drive Expansion Revenue from Existing Accounts
Expansion revenue is the cleanest LTV improvement available. It raises the ARPU component of the LTV formula without adding any new acquisition cost.
A customer acquired at $2,000 MRR who expands to $3,500 MRR over 24 months has a 75% higher LTV than the original model projected. The CAC number stays identical — because you paid it once, at the original acquisition. The ratio improves automatically.
Expansion Revenue Paths
- Seat expansion. Usage-based metrics (active users, seats, API calls) grow naturally as customers embed the product deeper. Set alerts when usage approaches plan limits and trigger an expansion conversation before the customer hits a hard wall.
- Feature upsells. Customers on lower tiers who consistently use advanced features they do not yet have access to are the highest-conversion upsell target. Track feature-adjacent behavior as a trigger, not tenure or contract anniversary.
- Cross-sells to adjacent products. Customers who have achieved meaningful ROI from one product are 3–5x more likely to adopt a second product than a net-new prospect. Build a formal cross-sell motion into CS workflows at the 6-month and 12-month marks.
Companies with net dollar retention above 120% demonstrate that the business grows even without acquiring a single new customer. That is the most efficient growth engine in SaaS. It is also the strongest signal to acquirers and investors that the product delivers genuine value.
Lever 3: Raise Gross Margin
LTV is not calculated on revenue. It is calculated on gross margin. A business with 60% gross margin has a materially lower LTV than one with 80% gross margin at the same ARPU and churn rate.
This distinction matters most in companies that undercount COGS. Common omissions include: hosting and infrastructure costs allocated to COGS, customer success salaries treated as operating expenses, third-party integration fees passed through at cost, and professional services delivered as part of the SaaS contract.
How to Move Gross Margin
- Renegotiate infrastructure contracts. Cloud hosting costs scale with revenue but often do not decrease as a percentage as efficiently as they should. Committed use discounts, reserved instances, and architecture reviews typically recover 8–15% of hosting costs at scale.
- Productize professional services. If onboarding requires custom configuration by your CS team, that labor costs gross margin. Turning manual setup steps into product features raises gross margin while also improving the customer experience.
- Reduce customer-success-to-revenue ratio. High-touch support models cap gross margin. A structured migration from high-touch to tech-touch CS — triggered by health score and account maturity — keeps NRR high without the headcount cost growing linearly with revenue.
Software-only B2B SaaS businesses typically run 70–80% gross margins. Companies with significant services components run 40–60%. Knowing which category you are in — and why — shapes every LTV decision downstream.
Lever 4: Target Higher-ACV Customer Segments
Segment mix is a structural LTV lever. Enterprise customers at $80K average contract value do not simply pay more. They also churn less, expand more, and require proportionally less support per dollar of ARR.
Moving upmarket from SMB to mid-market can improve LTV:CAC by 40–80% even with higher CAC — because the LTV increase outpaces the acquisition cost increase. The math only works if the product is actually built for the new segment. Half-measures produce the worst outcome: enterprise-level CAC with SMB-level churn.
Signs That Upmarket Is the Right Move
- Your SMB churn rate exceeds 20% annually and you cannot fix it with CS investments
- Enterprise pilots consistently produce higher engagement and lower churn than your SMB base
- Your product has features being used by enterprise-adjacent customers at SMB contract values
- Competitors in your category have successfully moved upmarket with the same core product
Upmarket migration requires a pricing rearchitecture. The pricing strategy must reflect the value delivered at each segment level. A $2,000/month enterprise plan competes with $5,000/month tools. Set the price at the level where the customer sees obvious value — not at the level where you feel comfortable defending the number.
Lever 5: Reallocate Budget to Low-CAC Acquisition Channels
CAC varies by channel by a factor of 10x or more. Moving budget from high-CAC to low-CAC channels improves the ratio without touching LTV at all.
Organic search typically delivers LTV:CAC ratios of 5–10x after 12 months because the content investment is largely fixed and the traffic compounds over time. Referral programs deliver 6–10x because customers arrive pre-sold and churn less than cold-acquired cohorts. Paid social, by contrast, rarely exceeds 2:1 in B2B SaaS without heavy conversion rate optimization.
Channel LTV:CAC Benchmarks — B2B SaaS
| Acquisition Channel | Typical CAC Range | LTV:CAC Range | Payback Period |
|---|---|---|---|
| Organic Search / SEO | $500 – $3,000 | 5x – 12x | 3 – 8 months |
| Referral / Word of Mouth | $200 – $1,500 | 6x – 14x | 2 – 6 months |
| Content / Inbound | $800 – $4,000 | 4x – 9x | 5 – 10 months |
| Paid Search (Google Ads) | $2,000 – $8,000 | 2x – 5x | 10 – 18 months |
| Paid Social | $3,000 – $15,000 | 0.8x – 2.5x | 18 – 36 months |
| Outbound / SDR | $5,000 – $25,000 | 2x – 6x | 12 – 30 months |
These ranges are wide because they depend heavily on ACV, sales cycle length, and market maturity. The key insight is directional: channels where you pay to interrupt people cost 5–10x more than channels where people seek you out. The marketing channel ROI calculation should include LTV:CAC at the channel level as a required output — not a secondary report.
Reallocation requires patience. Organic and referral channels take 6–18 months to compound. Companies that cut paid channels without funding the alternatives first create a revenue gap. The sequence matters: build the low-CAC channels before reducing spend on the high-CAC ones.
Lever 6: Improve Lead-to-Close Conversion Rate
CAC is a function of both spend and yield. The same $100K in sales and marketing spend produces a CAC of $5,000 at 20 customers acquired and $3,333 at 30 customers acquired. Conversion rate improvement changes the denominator without touching the spend.
Where Conversion Rate Gains Live
- Top-of-funnel qualification. Unqualified leads inflate CAC because sales effort is spent on prospects who were never going to convert. A tighter ICP filter at the MQL stage reduces total sales time spent per customer acquired.
- Trial-to-paid conversion. For product-led growth companies, the conversion from free trial to paid is the largest single CAC lever. Moving trial-to-paid from 15% to 25% drops CAC by 40% at the same acquisition spend. Onboarding flow, activation milestones, and in-app nudges drive this number.
- Demo-to-close rate. In sales-assisted motions, the demo-to-close rate determines how much sales capacity you need per customer acquired. Improving demo quality, objection handling, and proposal clarity moves this rate. A 25% demo-to-close rate requires 4 demos per customer. A 40% rate requires 2.5 demos. That is 37% fewer sales hours per customer — which reduces allocated sales CAC.
Conversion rate improvements compound with channel reallocations. Moving more budget to higher-intent channels (organic search, referral) typically produces higher conversion rates in addition to lower raw CAC. The two levers work together.
Lever 7: Tighten ICP Fit at the Top of the Funnel
Wrong-fit customers are the most destructive force in SaaS unit economics. They inflate CAC, suppress LTV, and consume disproportionate CS resources — all simultaneously.
A customer who was never a genuine fit has a 3–5x higher churn probability than a well-qualified customer. Their support ticket volume runs 2–4x higher. Their NPS is lower, so they do not refer. Their expansion probability is near zero. Every wrong-fit customer acquired moves the LTV:CAC ratio in the wrong direction on both sides of the equation.
How to Tighten ICP Without Killing Pipeline
- Analyze your best customers first. Pull the top 20% of accounts by LTV, NDR, and engagement score. Identify the 3–5 firmographic and behavioral attributes they share: company size, industry, tech stack, team structure, or use case. This is your real ICP — the pattern from revenue, not from theory.
- Score inbound leads against ICP fit. Apply a numeric ICP score to every inbound lead. Leads below a threshold go to a lower-cost nurture sequence rather than consuming a full sales motion. This drops sales CAC without reducing pipeline quality.
- Disqualify faster, not slower. A 2-week sales cycle ending in disqualification costs 4x more than a disqualification in day 3. Train sales to identify and exit non-fit deals early. The pipeline number drops but the conversion rate and average LTV per customer acquired both rise.
- Feed ICP signals back into marketing. Use closed-won data to refine audience targeting in paid channels. Lookalike audiences built on best customers perform 2–3x better than interest-based targeting alone.
Lever 8: Build a Customer Referral Engine
Referred customers are the highest-LTV customer segment in most SaaS businesses. They cost less to acquire. They convert faster. They churn less. And they refer others.
The typical referral CAC is 60–80% lower than outbound or paid acquisition. Referred customers churn at rates 18–30% lower than non-referred cohorts because they were introduced through an existing customer relationship — which creates pre-qualified trust and genuine use case fit.
Building a Referral Engine That Scales
- Trigger referral asks at peak satisfaction moments. The highest-conversion referral requests come immediately after value delivery — after the first successful outcome, after a renewal, after a significant expansion. Timing matters more than incentive size.
- Simplify the referral mechanics. Every friction point in the referral process reduces conversion. A single link, a name-and-email form, and a defined reward structure produce more referrals than complex portal-based programs.
- Track referral attribution rigorously. Referral programs fail when nobody knows they are working. Tag referred opportunities in the CRM from first contact, track their conversion and churn cohorts separately, and report referral LTV:CAC monthly to demonstrate the ROI of the program.
- Reward referrers for LTV, not just acquisition. Incentives tied to the referred customer's first payment align the referrer's interest with customer quality. Incentives paid on a 12-month retention milestone produce even better results.
A referral engine is not a one-time campaign. It is an operating system that captures value from every satisfied customer. Companies with strong referral programs reduce blended CAC by 20–40% over 3 years as the channel scales.
LTV:CAC and CAC Payback Period — Understanding the Difference
A strong LTV:CAC ratio does not guarantee cash flow health. These two metrics answer different questions.
LTV:CAC measures total lifetime efficiency. CAC payback period measures how long you wait before recovering the acquisition investment. A company with a 5:1 ratio and a 30-month payback period needs significant capital to fund growth — because each customer costs 30 months of cash before turning positive.
A company with a 3:1 ratio and a 10-month payback is often in a better operational position because acquisition cost is recovered quickly and can be reinvested in the next customer cohort. The CAC payback period is the cash-flow version of the same question that LTV:CAC answers from a total value perspective.
For capital-constrained businesses, prioritize payback period improvement alongside ratio improvement. For well-capitalized businesses with clear path to scale, the ratio matters more because it governs the long-term economics of the business model.
Both metrics connect to burn multiple — how much you burn per dollar of new ARR added. Companies with poor LTV:CAC and long payback periods also tend to have high burn multiples. Fixing the underlying unit economics improves all three metrics simultaneously.
How Fairview Surfaces LTV:CAC Intelligence
Most teams calculate LTV:CAC in a spreadsheet updated quarterly. By the time the number arrives in a review, the underlying driver has been drifting for 60–90 days without intervention.
Fairview's Margin Intelligence connects your CRM (HubSpot, Salesforce, Pipedrive), billing system (Stripe, QuickBooks), and ad platforms (Google Ads, Meta Ads) into a single operating view. The Pipeline Health Monitor surfaces cohort-level churn signals and expansion opportunities before they appear in the quarterly LTV calculation. The Next-Best Action Engine identifies which accounts to contact for expansion based on usage signals — not calendar dates.
The Data Connection Layer normalizes revenue data across sources — closing the calculation errors described earlier. CAC is computed with full sales and marketing spend allocated by channel. LTV uses gross margin automatically, not top-line revenue. The result is a ratio you can trust — updated continuously, not assembled in a spreadsheet once a quarter.
Key Takeaways
- 3:1 is the floor. Below it, you spend more acquiring customers than they return in margin. 4:1–5:1 is strong. Above 5:1 may indicate underinvestment in growth.
- Churn is the highest-impact LTV lever. Halving annual churn doubles LTV at the same ARPU and margin. No other single action has this magnitude of impact on the ratio.
- Always calculate LTV on gross margin, not revenue. Using top-line revenue overstates LTV by 20–40% depending on your margin profile.
- Segment before diagnosing. A healthy blended ratio can conceal channel-level destruction. Organic search at 9:1 and paid social at 0.8:1 average to 4:1 — but the business is destroying value on paid.
- LTV:CAC and CAC payback are different instruments. A strong ratio with a long payback period creates cash flow strain. Both need to be managed, not just the ratio.
- Most businesses only work 2–3 of 8 levers. Churn and CAC reduction get the most attention. Expansion revenue, gross margin improvement, and ICP tightening each deliver comparable gains and are frequently ignored.
Improving your LTV:CAC ratio is not a single-quarter project. It is a compounding operating discipline. Each lever improvement makes the next one easier because a better customer base churns less, expands more, and refers more.