TL;DR
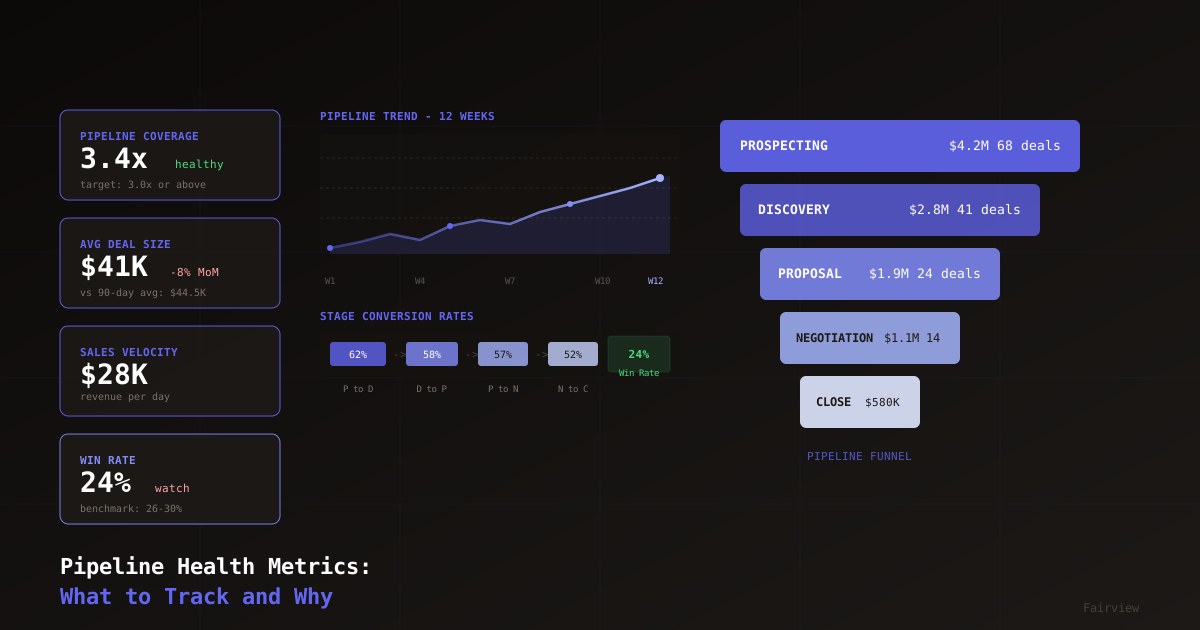
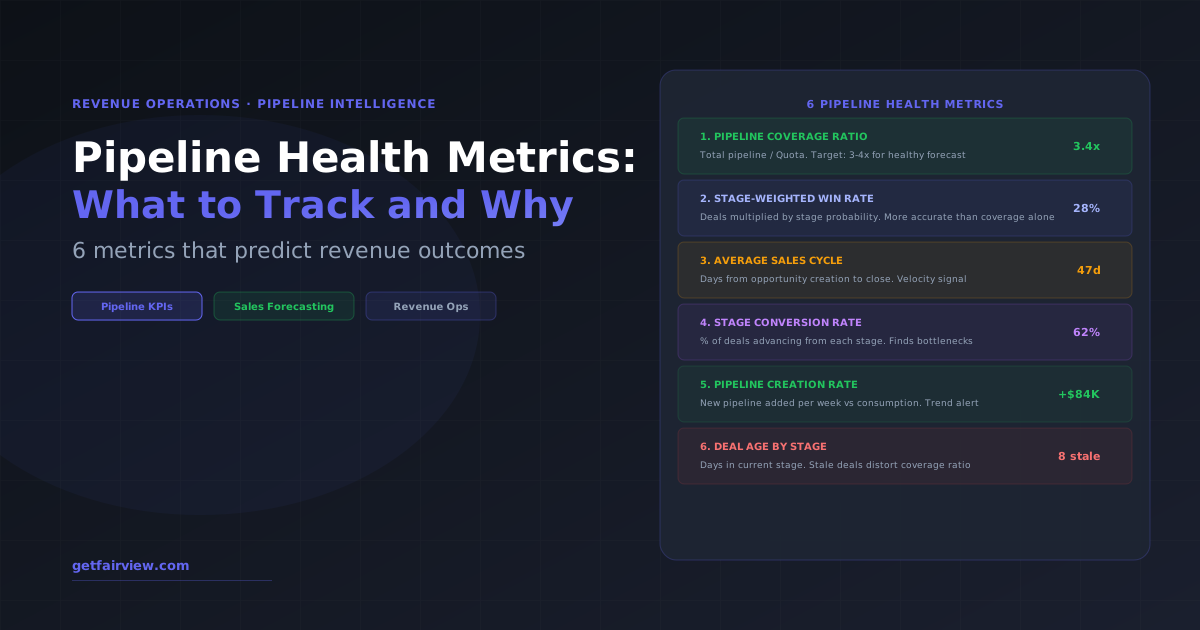
Pipeline coverage ratio is the most-tracked pipeline metric, but it is also the most misleading when used alone. A healthy pipeline requires six signals: coverage ratio, stage-weighted win rate, average sales cycle length, stage conversion rate, pipeline creation rate, and deal age by stage. Together these measure coverage, velocity, and quality — the three dimensions that actually predict whether a quarter closes. This guide covers each metric, its formula, benchmarks, and what to do when it goes off-track.
Most sales teams track one pipeline metric: total pipeline versus quota. If the number is above 3×, the quarter feels safe. If it drops below 2×, the panic starts. But pipeline coverage alone tells you almost nothing about pipeline quality — and a weak, stale, or mis-staged pipeline at 3.5× will miss quota just as often as a coverage deficit.
The teams that forecast accurately and hit quota consistently track pipeline across three dimensions: coverage (how much), velocity (how fast), and quality (how likely). This guide covers the six metrics that span all three dimensions, with the formulas, benchmarks, and response playbooks for each.
Why Pipeline Coverage Alone Is Insufficient
Pipeline coverage answers the question: "Do we have enough deals to hit quota?" But it does not answer: "Are those deals actually going to close?" A CRM full of stale opportunities, poorly qualified deals, and stuck Stage 2 prospects can show 4× coverage while delivering 60% of quota.
The coverage ratio calculation is straightforward:
A 3.5× ratio on a $1M quarterly quota means $3.5M in pipeline. But consider two scenarios:
- Scenario A: $3.5M pipeline with 45% of deals at Stage 3+ (evaluation or later), average deal age of 28 days, 62% stage conversion rate. Likely to close: $1.1M–$1.3M.
- Scenario B: $3.5M pipeline with 12% at Stage 3+, average deal age of 71 days, 38% stage conversion. Likely to close: $500K–$700K.
Same coverage ratio. Radically different outcomes. The additional five metrics separate Scenario A from Scenario B before the quarter ends — not after.
The 6 Pipeline Health Metrics Every RevOps Team Should Track
Metric 1: Pipeline Coverage Ratio
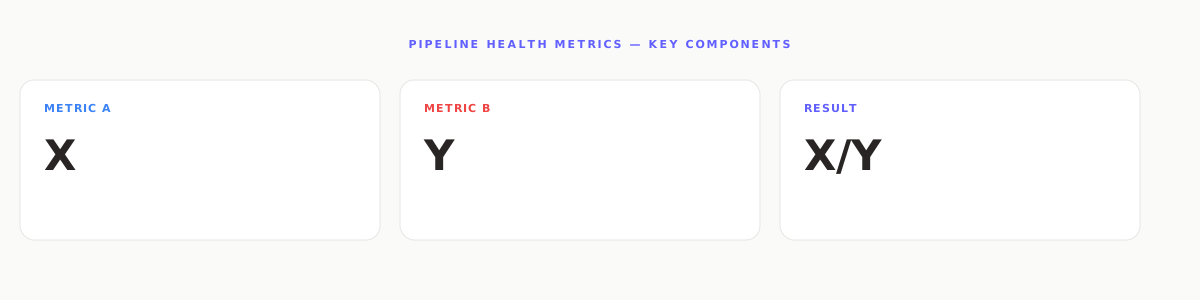
Pipeline Coverage Ratio
Total Pipeline ÷ Quota for the Period
The baseline volume signal. Tells you whether you have enough deals to hit quota even with average conversion rates.
| Coverage Ratio | Signal | Action |
|---|---|---|
| Below 2.5× | Coverage deficit | Immediate pipeline generation sprint — SDRs, outbound, campaigns |
| 2.5–3.0× | Tight — watch closely | Accelerate top-of-funnel; do not rely on large deal close |
| 3.0–4.0× | Healthy | Focus on velocity and quality — do not add junk pipeline |
| 4.0–5.0× | Strong | Prioritize deal qualification; remove stale deals from count |
| Above 5.0× | Possible inflation | Audit for stale deals and poor qualification — coverage may be illusory |
Metric 2: Stage-Weighted Pipeline Value
Stage-Weighted Pipeline Value
Sum of (Deal Value × Stage Win Probability) for all open deals
A more accurate view of expected revenue than raw pipeline volume. A $500K deal at Stage 2 (20% probability) contributes $100K; a $200K deal at Commit (80%) contributes $160K.
Stage-weighted value corrects the distortion that comes from counting all deals equally regardless of stage. When you compare stage-weighted value to quota, you get a more realistic picture of where the quarter is tracking.
What a large gap reveals: If raw pipeline is $3.5M but stage-weighted value is $720K against a $1M quota, the pipeline is heavily concentrated in early stages. You have volume but not close-ready deals. The response is different from a coverage deficit: you need deal velocity, not more top-of-funnel.
Metric 3: Average Sales Cycle Length
Average Sales Cycle Length
Total days from opportunity creation to close (won) ÷ Number of closed-won deals
Velocity signal. Shows how fast deals move from first contact to revenue. Compare actuals to your target cycle length.
If your average sales cycle has been lengthening quarter over quarter, that is a product-market fit signal, a competitive pressure signal, or an internal sales process friction signal — and you cannot know which without looking at the data by segment, rep, and deal size.
Track cycle length by: deal size tier (small, mid, enterprise), customer segment (SMB, mid-market, enterprise), and individual rep. When a specific rep's cycle is 40% longer than the team median, that is a coaching opportunity. When a segment's cycle is accelerating, that is a market shift.
Metric 4: Stage Conversion Rate
Stage Conversion Rate
Deals entering next stage ÷ Deals entering current stage × 100
Finds the specific stage where your pipeline leaks. Tracks what percentage of deals successfully advance through each gate.
Stage conversion rates show you where pipeline is lost — not just that it is lost. If 70% of deals advance from Stage 1 (Qualified) to Stage 2 (Discovery), but only 38% advance from Stage 2 to Stage 3 (Evaluation), the problem is at the discovery-to-evaluation gate. That is where the rep training, product messaging, or qualification criteria need attention.
| Stage | Good Rate | Warning Rate | If Below Warning |
|---|---|---|---|
| MQL → SQL | Above 30% | Below 15% | Marketing quality or SDR criteria problem |
| SQL → Discovery | Above 60% | Below 40% | SDR-to-AE handoff or outreach quality |
| Discovery → Eval | Above 50% | Below 30% | Demo quality or qualification depth |
| Eval → Proposal | Above 65% | Below 45% | Competitive positioning or champion development |
| Proposal → Close | Above 70% | Below 50% | Negotiation, legal, or procurement friction |
Metric 5: Pipeline Creation Rate vs. Consumption Rate
Pipeline Creation Rate vs. Consumption
New pipeline added this week ÷ Pipeline closed (won + lost + pushed)
The health signal that coverage misses: are you building pipeline faster than you are burning it?
A pipeline creation rate below 1.0 means you are consuming pipeline faster than you are building it. At coverage 3.5× today, that trend leads to 2.1× in six weeks without intervention. This is the leading indicator that coverage is about to collapse — visible weeks before it happens in the coverage ratio itself.
Track pipeline creation rate weekly as part of your pipeline review. When it drops below 1.0 for two consecutive weeks, trigger a pipeline generation response immediately — do not wait for coverage to show the problem.
Metric 6: Deal Age by Stage
Deal Age by Stage
Days a deal has been in its current stage vs. target days per stage
Surfaces stale pipeline that inflates coverage without contributing to close. The silent killer of forecast accuracy.
Stale deals are the most common cause of inflated pipeline coverage and missed forecasts. A deal that has sat in Evaluation for 90 days when your average cycle is 47 days is either dead or severely delayed — but it still counts in the coverage ratio at full value.
Set maximum days per stage based on your historical data. Deals exceeding 1.5× the average stage duration should be flagged for manager review. Deals exceeding 2× should either have a clear explanation in the CRM or be moved to a stalled/at-risk stage.
Track All 6 Pipeline Health Metrics Automatically
Fairview surfaces pipeline coverage, stage conversion rates, deal age alerts, and pipeline velocity automatically from your CRM — so your weekly pipeline review takes minutes, not hours.
Book a DemoHow to Run a Weekly Pipeline Health Review
The six metrics above are most valuable when reviewed on a consistent cadence. A 15–20 minute weekly pipeline review using these six metrics catches problems before they become forecast misses. Here is the structure:
- Coverage check (2 min): Total pipeline vs. quota for the current quarter. Flag if below 3×. Note the trend vs. last week.
- Stage-weighted value (2 min): Where is the weighted value vs. quota? Is there enough late-stage pipeline to cover the quarter?
- Creation vs. consumption (2 min): Is new pipeline keeping pace with pipeline being consumed? Flag negative ratio weeks.
- Stale deal audit (5 min): Review deals flagged as exceeding maximum stage age. What is the status? Update or move to stalled.
- Stage conversion review (5 min): Which stages are underperforming conversion targets? What is the response?
- Actions (5 min): Specific owners for pipeline generation, deal acceleration, and coaching based on the above.
Common Mistakes in Pipeline Health Tracking
Tracking coverage only in aggregate. A 3.5× aggregate coverage can hide a rep with 1.8× coverage and a rep with 6× (mostly stale) coverage. Coverage should be tracked by rep, segment, and territory — not just total.
Including all opportunity stages in coverage. Some teams include Stage 1 (Qualified) in their coverage number. A deal in initial qualification should not carry the same weight as a deal in Evaluation. Consider tracking Stage 3+ coverage separately as your "close-ready" pipeline — this is the most reliable near-term indicator.
Ignoring pipeline creation rate. Most weekly pipeline reviews focus entirely on what exists in the funnel, not on the rate at which new pipeline is being added. A team that adds $80K in pipeline weekly but closes $200K cannot maintain current coverage. The math is inevitable — it just takes a few weeks to show up.
Not defining stage exit criteria. Stage conversion rates are only meaningful if stage definitions are consistent across reps. When "Evaluation" means "we had a discovery call" for one rep and "we completed a technical POC" for another, conversion metrics are incomparable. Stage exit criteria should be documented and enforced in the CRM.
Frequently Asked Questions
What are good pipeline health metrics to track? +
The 6 most important pipeline health metrics are: (1) pipeline coverage ratio — total pipeline divided by quota, target 3–4×; (2) stage-weighted pipeline value — deals weighted by close probability at each stage; (3) average sales cycle length — days from creation to close; (4) stage conversion rate — percentage advancing between stages; (5) pipeline creation rate vs. consumption; and (6) deal age by stage — stale deals flagged against maximum days per stage.
How do you measure pipeline health? +
Pipeline health is measured across three dimensions: coverage (how much pipeline exists relative to quota), velocity (how fast deals move through stages), and quality (what percentage of deals actually close at each stage). A healthy pipeline has 3–4× coverage, improving or stable stage conversion rates, deal age within 1.5× of your average days per stage, and a pipeline creation rate above 1.0 (adding more than you are consuming).
What is a good pipeline coverage ratio? +
A healthy pipeline coverage ratio is 3–4× of your quota for the period. If your quarterly quota is $500K, you need $1.5M–$2M in pipeline. Below 3× signals a coverage deficit — you may not have enough deals to hit quota even with strong conversion rates. Above 5× can indicate pipeline inflation from poorly qualified or stale deals that overstate coverage without improving close likelihood.
What is pipeline velocity? +
Pipeline velocity measures how fast revenue moves through your sales process. Formula: (Number of Opportunities × Win Rate × Average Deal Value) ÷ Sales Cycle Length in days. The result is a daily or weekly dollar value of revenue flowing through the pipeline. Increasing velocity — by improving win rate, deal size, or shortening cycle time — accelerates revenue without necessarily adding more pipeline volume.
Which is an example of a pipeline metric? +
Pipeline coverage ratio is the most common example: if your quota is $1M for the quarter and you have $3.5M in active pipeline opportunities, your coverage ratio is 3.5×. Other pipeline metrics include stage conversion rate (the percentage of deals advancing from Stage 2 to Stage 3), average deal cycle time (47 days from creation to close), and deal age by stage (a deal has been in Evaluation for 82 days vs. a 30-day target).
Key Takeaways
- Pipeline coverage is necessary but not sufficient. It tells you volume, not velocity or quality — and missing any of the three makes forecasts unreliable.
- Stage-weighted value is the more accurate near-term forecast signal, because it accounts for where in the funnel deals actually are.
- Pipeline creation rate vs. consumption is the leading indicator that coverage is about to collapse — visible weeks before the coverage ratio shows the problem.
- Stage conversion rates identify the specific bottleneck in your funnel — the gate where deals stall — so you can direct coaching and process fixes precisely.
- Deal age by stage exposes the stale pipeline that inflates coverage and poisons forecast accuracy.
- A 15-minute weekly pipeline review using all six metrics catches problems early enough to intervene — most teams that miss quarters could have seen the signal 4–6 weeks before month-end.
Related reading: Pipeline Coverage Ratio: What to Target, What Is Sales Forecasting?, and RevOps KPIs: The Metrics That Actually Matter.
Siddharth Gangal
Founder, Fairview · LinkedIn
Building operating intelligence tools for revenue teams. Previously ran RevOps at two B2B SaaS companies.