TL;DR
- What it is: Sales forecasting is the process of estimating future revenue by analyzing historical data, current pipeline, and market conditions. It is not guesswork — it is a structured method for reducing uncertainty about future revenue.
- Six core methods: Historical trend, pipeline-weighted, stage-based, velocity-based, bottom-up, and top-down. Each fits a different business type and data maturity level. Most accurate operators blend two or more.
- Accuracy benchmarks: Company-level MAPE under 10% is acceptable; under 5% is strong. Segment-level variance of 15–20% is normal. The trend matters more than the absolute number.
- Common mistakes: Confusing forecast with target, updating too infrequently, ignoring data quality, and failing to weight pipeline by stage. These four errors explain most forecast misses.
- Decision signal: If your quarterly forecast is consistently off by more than 15%, the problem is rarely the method. It is usually the data going into it — or the process around it.
Sales forecasting is not guessing with a spreadsheet. It is the disciplined practice of estimating future revenue from evidence — historical patterns, current pipeline composition, and the specific conditions that affect deal closure. When it works, leadership knows where the quarter will land before the quarter ends. When it fails, teams discover gaps in the final two weeks and spend those weeks in reactive panic rather than proactive correction.
This guide explains what sales forecasting actually is, walks through the six methods operators use, compares qualitative and quantitative approaches, surfaces the mistakes that destroy accuracy, and gives you benchmarks for what "good" looks like. By the end, you will have a clear framework for choosing a method, running the process, and improving accuracy over time.
Definition
Sales forecasting is the process of estimating future revenue for a defined period by analyzing historical sales data, current pipeline status, and relevant market conditions. A sales forecast produces a revenue range with associated confidence, not a single number. It is used for resource planning, hiring decisions, inventory management, and investor reporting.
What is sales forecasting?
Sales forecasting is the practice of predicting how much revenue a business will generate in a future period — typically a month, a quarter, or a year. The prediction is based on data, not intuition. The data comes from three sources: what has happened before (historical revenue and close rates), what is happening now (pipeline stage, deal value, rep activity), and what is changing in the environment (seasonality, competitive shifts, economic conditions).
The output of a forecast is not a single number. It is a range — an optimistic case, a conservative case, and a most-likely case — with a confidence level attached. A forecast that says "$1.2M" without context is less useful than a forecast that says "$1.0M to $1.4M, most likely $1.15M, Medium confidence." The range tells leadership what to plan for. The confidence tells them how much to trust it.
Forecasts serve three operational purposes. First, they inform resource allocation — how many people to hire, how much inventory to hold, how much marketing spend to authorize. Second, they surface risk early — a forecast that drops from $1.4M to $1.1M over three weeks is a signal that something in the pipeline has changed, and the team has time to respond. Third, they create accountability — when the forecast is owned by the people closest to the deals, the quality of pipeline data improves because the forecast is only as good as the inputs.
"A forecast is not a target. It is a prediction. Confusing the two is the most common cause of forecast inaccuracy."
The distinction between forecast and target matters. A target is what the business needs to achieve. A forecast is what the data says will happen. When leadership treats the target as the forecast — or pressures reps to raise their forecast to match the target — the forecast becomes fiction. The numbers look good on paper. The quarter still misses.
6 sales forecasting methods (and when to use each)
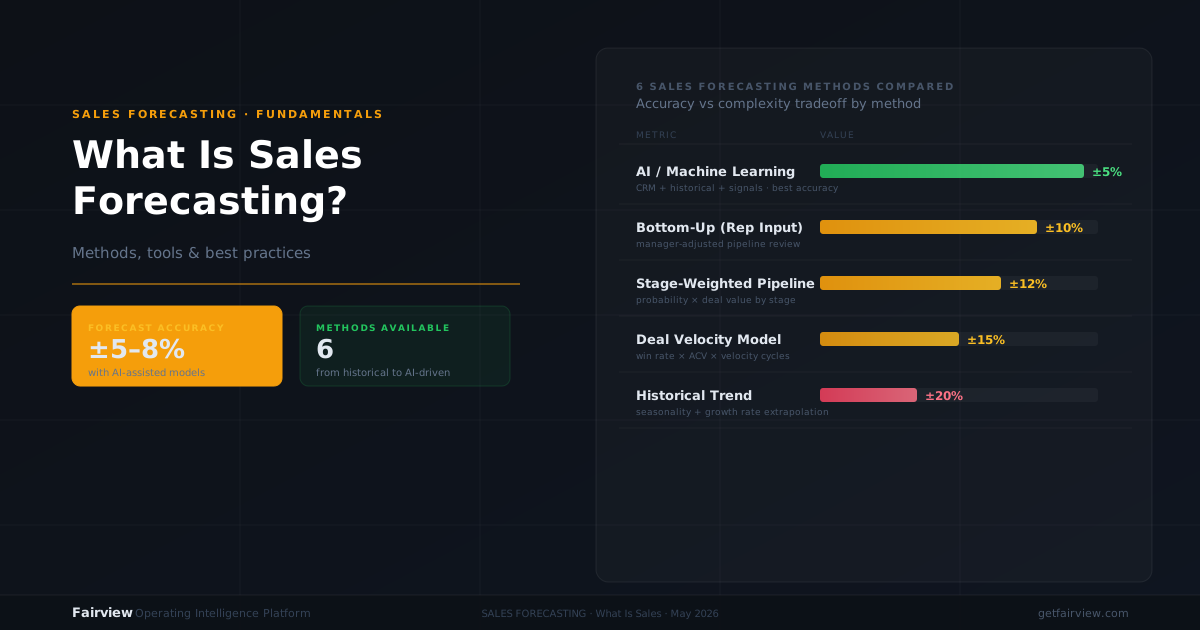
There is no single best forecasting method. The right method depends on your business model, your data maturity, your sales cycle length, and how many variables affect deal closure. Below are the six methods most commonly used by B2B operators, with the conditions under which each works best.
1. Historical trend forecasting
This method uses past revenue as the basis for future revenue. You look at the same period last year, adjust for known changes (new products, headcount additions, market shifts), and project forward. A simple version: "Q2 last year was $800K. We have grown 25% year over year. Q2 this year should be $1.0M."
Historical trend forecasting works best for businesses with stable seasonality, low deal-level variance, and predictable growth rates. It breaks down when the business is changing rapidly — new products, new markets, new pricing — because the past becomes a poor predictor of the future. It also fails for businesses with long sales cycles and few deals per quarter, where one large deal can swing the entire period.
Best for: Mature businesses with stable revenue patterns and multiple quarters of clean historical data.
2. Pipeline-weighted forecasting
This method assigns a probability of closure to each deal based on its stage, then sums the weighted values. If a $50K deal is in Stage 3 and your historical win rate for Stage 3 is 40%, the weighted forecast contribution from that deal is $20K. You repeat this for every deal in the pipeline and sum the results.
Pipeline-weighted forecasting is the most widely used method in B2B SaaS and professional services. It is more accurate than historical trends for businesses with defined sales stages and reasonable CRM hygiene. The accuracy depends entirely on two inputs: the stage-to-win-rate mapping (which must be based on actual historical data, not assumptions) and the deal value (which must be current and realistic).
The common failure mode: using default stage probabilities provided by the CRM vendor instead of calculating your own. A vendor might assume 20% win rate at Stage 2. Your actual win rate at Stage 2 might be 8%. Using the vendor default inflates the forecast by 2.5x at that stage.
Best for: B2B companies with structured sales processes, defined deal stages, and a CRM that captures stage history accurately.
3. Stage-based forecasting (opportunity stage)
This is a variation of pipeline-weighted forecasting that uses stage-specific win rates but applies them more granularly. Instead of one win rate per stage, you calculate win rates by stage and by segment — new business vs. expansion, enterprise vs. mid-market, inbound vs. outbound. A $100K enterprise deal in Stage 4 might have a 60% win rate. A $20K mid-market deal in the same stage might have a 45% win rate.
Stage-based forecasting improves accuracy when different segments behave differently. The cost is complexity — you need enough historical data to calculate reliable win rates per segment, and you need to maintain those calculations as the business evolves.
Best for: Companies with multiple customer segments, distinct sales motions, and enough deal volume to calculate segment-specific win rates.
4. Velocity-based forecasting
This method forecasts based on how fast deals move through the pipeline. It calculates the average time a deal spends in each stage, then projects when current deals will close based on their stage entry date. If deals typically spend 14 days in Stage 3 and a deal entered Stage 3 on May 1, velocity-based forecasting projects a close date around May 15.
Velocity-based forecasting is particularly useful for businesses with high deal volume and short sales cycles, where the timing of close matters as much as the probability. It also helps identify deals that are stalling — a deal that has been in Stage 3 for 35 days when the average is 14 days is a signal, not just a data point.
The limitation: velocity averages hide variance. If half your deals close in 7 days and half in 21 days, the average of 14 days is not representative of either group.
Best for: High-velocity sales models with many deals, short cycles, and a need to project close timing precisely.
5. Bottom-up forecasting
Bottom-up forecasting builds the forecast from individual rep projections. Each rep estimates their own pipeline for the period, the sales manager reviews and adjusts, and the aggregate becomes the company forecast. The method relies on rep judgment — which is both its strength and its weakness.
Bottom-up forecasting captures information that pipeline math cannot: a rep knows that a specific prospect's budget cycle starts in July, or that a champion just changed roles, or that a competitor just raised prices. This contextual knowledge improves accuracy for deals that don't fit historical patterns.
The weakness is bias. Reps are incentivized to be optimistic — pipeline optimism protects them from scrutiny and aligns with quota pressure. Without a structured review process, bottom-up forecasts are typically 15–25% higher than actuals.
Best for: Complex enterprise sales with long cycles, high deal values, and significant context that affects closure.
6. Top-down forecasting
Top-down forecasting starts with a market or company-level number and allocates it downward. For example: "Our addressable market is $50M. We have 2% market share. Next year we project 2.5% share. That gives us $1.25M in new revenue, plus $800K from existing accounts, for a total of $2.05M."
Top-down forecasting is useful for annual planning and investor presentations. It is not useful for quarterly operating decisions because it lacks deal-level detail. A top-down forecast cannot tell you which deals are at risk or which reps need support.
Best for: Annual planning, board presentations, and strategic goal-setting — not for weekly operating forecasts.
In practice: The most accurate operators do not choose one method. They run pipeline-weighted as the primary forecast, historical trends as a sanity check, and bottom-up rep judgment as a context layer. When the three agree, confidence is high. When they diverge, the divergence itself is a signal to investigate.
For a deeper comparison of forecasting methods with worked examples and selection criteria by business stage, see the dedicated guide.
Qualitative vs quantitative forecasting
Every forecasting method sits somewhere on a spectrum from purely qualitative to purely quantitative. Understanding where your process sits — and where it should sit — helps you identify gaps.
| Dimension | Qualitative | Quantitative |
|---|---|---|
| Primary input | Expert judgment, rep intuition, market knowledge | Historical data, pipeline metrics, statistical models |
| Accuracy driver | Experience of the forecaster | Quality and completeness of data |
| Best for | New markets, new products, no historical data | Mature businesses with clean CRM data |
| Common method | Bottom-up rep forecasts, executive estimates | Pipeline-weighted, regression, time-series |
| Bias risk | High — optimism, pressure, anchoring | Lower — but model assumptions can be wrong |
| Auditability | Low — hard to reconstruct why a number was chosen | High — every assumption is documented |
| Speed | Fast — can be produced in a meeting | Slower — requires data collection and modeling |
Purely qualitative forecasting is fast and captures context that data misses. It is also vulnerable to every cognitive bias in the book: optimism bias (reps overestimate their own deals), anchoring (the first number mentioned sets the range), and authority bias (the highest-paid person's opinion carries more weight than it should).
Purely quantitative forecasting is auditable and consistent. It is also blind to context that hasn't been captured in the data model. A regression model cannot know that your biggest prospect's procurement team just froze all new vendor approvals.
The practical answer for most operators is a blended approach. Use quantitative methods as the foundation — they provide the structure, the consistency, and the audit trail. Layer qualitative judgment on top for deals that don't fit the model: new products, unusual deal sizes, prospects with known internal changes. The quantitative forecast gives you the baseline. The qualitative layer tells you where to adjust it.
"Quantitative forecasting tells you what the data says. Qualitative forecasting tells you what the data doesn't know. You need both."
Common forecasting mistakes (and how to avoid them)
Most forecast misses are not caused by bad models. They are caused by bad inputs, bad process, or bad incentives. Here are the six mistakes we see most often — and the fixes that address them.
1. Confusing forecast with target
This is the most damaging mistake because it corrupts the entire process. When a CEO announces a $2M quarterly target and the sales leader produces a $1.6M forecast, the pressure to "bridge the gap" is intense. Reps are asked to "find" another $400K. They do — by moving deals forward in the pipeline, inflating deal values, or adding opportunities that don't exist yet.
The result: the forecast shows $2.0M. The actual closes at $1.55M. The forecast was wrong by 22%. But the forecast wasn't wrong — it was manipulated to match a target.
The fix: Separate the forecast process from the target-setting process. The forecast is produced by the data and the reps who own the deals. The target is set by leadership based on business needs. The gap between forecast and target is a business problem to solve — through marketing investment, pricing changes, or hiring — not a forecasting problem to hide.
2. Updating too infrequently
A forecast produced on the first day of the quarter and never updated is a snapshot, not a forecast. Deals slip. New opportunities enter the pipeline. Competitive dynamics shift. A forecast that doesn't reflect these changes becomes less accurate with each passing week.
The fix: Update the forecast weekly at minimum. In the final month of a quarter, update it twice weekly. The update should be a structured process — same day, same format, same owner — not an ad-hoc request when someone gets nervous.
3. Ignoring data quality
A pipeline-weighted forecast is only as good as the pipeline data. If 30% of deals lack a close date, if deal values are set at list price and never updated after negotiation, if stages are changed without documented criteria — the forecast is garbage in, garbage out. The model is not the problem. The data is.
The fix: Invest in CRM hygiene before investing in forecasting sophistication. Define clear stage criteria. Require close dates on every deal. Update deal values after every pricing conversation. Run a data quality report weekly and fix the top issues before running the forecast.
4. Using one win rate for all segments
A single win rate applied across all deals ignores the reality that different segments close at different rates. Enterprise deals close less often than SMB deals. Inbound closes more often than outbound. Expansion closes more often than new business. Applying an average win rate of 25% to all deals means your enterprise forecast is too high and your expansion forecast is too low.
The fix: Calculate win rates by segment — at minimum, by deal size band and by new vs. expansion. If you don't have enough data for segment-level rates yet, acknowledge the uncertainty in your forecast range rather than pretending precision you don't have.
5. Ignoring seasonality and timing
Many B2B businesses have predictable seasonal patterns: Q4 is strong (budget flush), Q1 is weak (new year planning), summer is slow (vacation season). A forecast that assumes linear month-over-month growth will miss these patterns by 20% or more in the affected quarters.
The fix: Build seasonality into your historical trend baseline. Look at the same period last year, not just the prior quarter. For pipeline-weighted forecasts, adjust close probability by month based on historical performance.
6. No post-mortem process
Teams that miss their forecast often move on to the next quarter without analyzing why. The same mistakes repeat. The same biases persist. Accuracy never improves.
The fix: Run a 30-minute forecast post-mortem in the first week of each new quarter. Compare forecast to actual by segment, by rep, and by stage. Identify the biggest sources of variance. Adjust the model or the process based on what you learn. Forecast accuracy is a skill that improves with practice — but only if you review the practice.
Tools that help
The tool you use for forecasting should match your data maturity, your team size, and the complexity of your sales motion. Here is how the three main categories compare.
Spreadsheets (Excel, Google Sheets)
Spreadsheets are where most forecasting starts — and for early-stage businesses, they are often sufficient. A simple pipeline-weighted forecast can be built in under an hour with VLOOKUPs and SUMPRODUCT. The advantages are flexibility, zero cost, and universal familiarity. The disadvantages are manual data entry, version control chaos, and no automated refresh.
Spreadsheets work until they don't. The breaking point is usually around 20–30 active deals or 3+ reps, when manual updates become a burden and the risk of formula errors increases. At that point, a CRM-native forecasting tool becomes worth the investment.
CRM-native forecasting (Salesforce, HubSpot, Pipedrive)
Modern CRMs include built-in forecasting modules that pull pipeline data directly from the deals your reps are already managing. Salesforce's forecasting tool is the most mature, with support for multiple forecast categories, override tracking, and team rollup. HubSpot's forecasting is simpler but easier to set up. Pipedrove's forecast view is lightweight and suitable for smaller teams.
The key advantage of CRM-native forecasting is data freshness — the forecast updates as deals update, without manual export. The key disadvantage is that CRM forecasts are only as good as the CRM data. If your reps don't update deal stages promptly, the forecast lags reality by days or weeks.
Operating intelligence platforms
For operators who want forecasting integrated with margin, pipeline health, and next-best-action recommendations, an operating intelligence platform goes further than a CRM forecast module. These platforms connect CRM data with finance and marketing data, calculate forecast confidence based on pipeline composition, and surface the specific deals most likely to affect the number.
The trade-off is complexity. A full operating intelligence platform requires more setup than a CRM forecast view. The return is a forecast that sits inside a broader operating rhythm — not an isolated number, but a signal within a system of signals.
| Tool type | Best for | Setup time | Accuracy ceiling |
|---|---|---|---|
| Spreadsheets | 1–2 reps, early stage, simple pipeline | 1–2 hours | Moderate — limited by manual data |
| CRM-native | 3–20 reps, structured process, CRM discipline | 1–2 days | Good — if CRM data is clean |
| Operating intelligence | 10+ reps, multi-source data, weekly operating rhythm | 1–2 weeks | High — integrated with margin and pipeline health |
Forecast accuracy: what good looks like
Forecast accuracy is measured by comparing the forecast to the actual result. The most common metric is Mean Absolute Percentage Error (MAPE): the average absolute difference between forecast and actual, expressed as a percentage of actual.
If you forecast $1.0M and actual is $1.1M, the error is $100K. The percentage error is 9.1%. MAPE averages this across multiple periods. A MAPE of 10% means your forecasts are off by 10% on average — sometimes high, sometimes low, but the magnitude of error is consistent.
Another useful metric is forecast bias: the tendency to consistently over-forecast or under-forecast. If your forecasts are 15% too high every quarter, your MAPE might look acceptable (it averages out the direction), but your bias is a serious problem. Bias indicates a systematic issue — optimistic reps, pressure from leadership, or a model that doesn't account for a structural change.
Benchmarks by business stage
| Stage | Company-level MAPE | Segment-level MAPE | Bias target |
|---|---|---|---|
| Seed / early ($0–$3M ARR) | 15–25% | 25–40% | Within ±10% |
| Growth ($3M–$15M ARR) | 10–15% | 15–25% | Within ±5% |
| Scale ($15M–$50M ARR) | 5–10% | 10–20% | Within ±3% |
| Mature ($50M+ ARR) | Under 5% | Under 15% | Within ±2% |
These are directional benchmarks, not absolutes. A seed-stage company with a MAPE of 20% is not failing — it is operating with limited data and high variance. What matters is the trend: is accuracy improving quarter over quarter? If your MAPE was 22% in Q1, 18% in Q2, and 14% in Q3, you are on the right track. If it was 12% in Q1 and 19% in Q3, something in your process has degraded.
For a detailed breakdown of forecast accuracy metrics, formulas, and the seven levers that move the number, see the dedicated guide.
How Fairview improves forecast confidence
This guide has focused on sales forecasting as a discipline — the methods, the mistakes, and the benchmarks. Before closing, it is worth explaining where Fairview fits into this picture — and why we describe our forecasting capability as a confidence engine rather than a forecast generator.
Most forecasting tools produce a number. Fairview's Forecast Confidence Engine produces a number and a confidence score — High, Medium, or Low — based on the composition of the pipeline feeding into it.
The confidence score is not a guess. It is calculated from four inputs: the distribution of deals across stages (a forecast based mostly on early-stage deals gets Low confidence), the historical accuracy of similar pipeline compositions (has this mix of deals closed at this rate before?), the presence of deals without recent activity (stalled deals reduce confidence), and the variance between optimistic and conservative scenarios (a wide range indicates uncertainty).
The output is not a single forecast number. It is a range — optimistic to conservative — with a confidence label that tells you how much to trust it. A forecast of $1.2M with High confidence means the data supports the number. A forecast of $1.2M with Low confidence means the pipeline is thin, the deals are early-stage, or the historical variance is high. The number is the same. The action should be different.
Fairview also connects the forecast to the rest of the operating picture. The Pipeline Health Monitor flags deals that are stalling — no activity in a configurable number of days, close dates slipping — so you can address them before they affect the quarter. The Weekly Operating Report compares actual revenue to forecast every Monday, so drift is caught in days, not weeks. And the Next-Best Action Engine surfaces specific recommendations when the forecast moves — which deals to prioritize, which accounts to check, which campaigns to review.
The honest scope: Fairview does not replace the judgment of a skilled sales leader. What it does is reduce the assembly work — the pulling, reconciling, and calculating — so that judgment can be applied to the right problems. If your team is spending more time building the forecast than acting on it, the tool is solving the wrong part of the problem.
Key takeaways
- Sales forecasting is the structured practice of estimating future revenue from historical data, current pipeline, and market conditions. It is not guessing, and it is not the same as a sales target.
- Six methods dominate: historical trend, pipeline-weighted, stage-based, velocity-based, bottom-up, and top-down. The most accurate operators blend pipeline-weighted as the foundation with historical trends and rep judgment as context layers.
- Qualitative and quantitative forecasting each have strengths. Quantitative methods provide consistency and auditability. Qualitative methods capture context that data misses. A blended approach outperforms either alone.
- The four most common forecasting mistakes are: confusing forecast with target, updating too infrequently, ignoring data quality, and applying one win rate across all segments. Fixing these four issues improves accuracy more than switching to a more sophisticated model.
- Company-level MAPE under 10% is acceptable; under 5% is strong. The trend in accuracy matters more than the absolute number. A forecast process that improves by 2–3 percentage points per quarter is on the right trajectory.
- Forecasting tools should match your stage. Spreadsheets work for 1–2 reps. CRM-native tools work for 3–20 reps with clean data. Operating intelligence platforms integrate forecasting with pipeline health, margin, and next-best-action for teams running a weekly operating rhythm.
If your team is ready to move from forecast assembly to forecast confidence, Fairview connects your CRM, finance, and marketing data into one operating view — and shows you the range, the confidence, and the specific actions that protect the number. Book a demo to see how the Forecast Confidence Engine works with your pipeline data.
What is the most accurate sales forecasting method?
No single method is most accurate for every business. Pipeline-weighted forecasting tends to be most accurate for B2B companies with structured CRM data and defined deal stages. Historical trend methods work well for businesses with stable seasonality and low deal-level variance. The most accurate approach in practice is usually a blend: pipeline-weighted for the near term, historical trends for baseline context, and rep judgment for deals that don't fit the model.
How often should a sales forecast be updated?
For most B2B operators, the forecast should be reviewed weekly and refreshed whenever a material event occurs — a large deal closes early, a key prospect pushes, or a rep leaves. Weekly updates catch drift before it compounds. Daily updates are useful in the final two weeks of a quarter. Monthly updates are too infrequent for most businesses; by the time you discover a gap, you have limited time to close it.
What is a good forecast accuracy benchmark?
At the company level, a MAPE of 10% or lower is acceptable for early-stage businesses, 5–10% is solid for growth-stage companies, and under 5% is strong for mature operations with clean data. At the segment or product level, variance will be higher — 15–20% is common. The benchmark that matters most is your own trend: is accuracy improving quarter over quarter?
What data do you need for sales forecasting?
The minimum data set includes: historical closed revenue by period, current pipeline with deal stage and value, historical win rates by stage, average sales cycle length, and rep-level performance history. For more sophisticated forecasts, you also need: deal source, customer segment, product mix, seasonality patterns, and marketing spend correlation. The quality of the forecast depends more on data cleanliness than on data volume.
Can you forecast sales without a CRM?
Yes, but not well. Without a CRM, you are relying on rep memory, spreadsheets, and informal tracking. This produces forecasts with high variance and low auditability. A CRM provides structured deal data, stage history, and activity records that form the foundation of any repeatable forecasting process. If you are forecasting without a CRM, your first investment should be getting one in place before building a forecast model.
What is the difference between a sales forecast and a sales target?
A sales forecast is an estimate of what will happen based on data and assumptions. A sales target is a commitment to what should happen based on business goals. The forecast informs the target; the target does not change the forecast. Confusing the two is a common source of forecast inaccuracy — reps pressured to hit a target will inflate their pipeline estimates, which degrades the forecast for the next quarter.