TL;DR
- • Net dollar retention (NDR) measures how much revenue you keep and grow from existing customers — the single most important SaaS health metric.
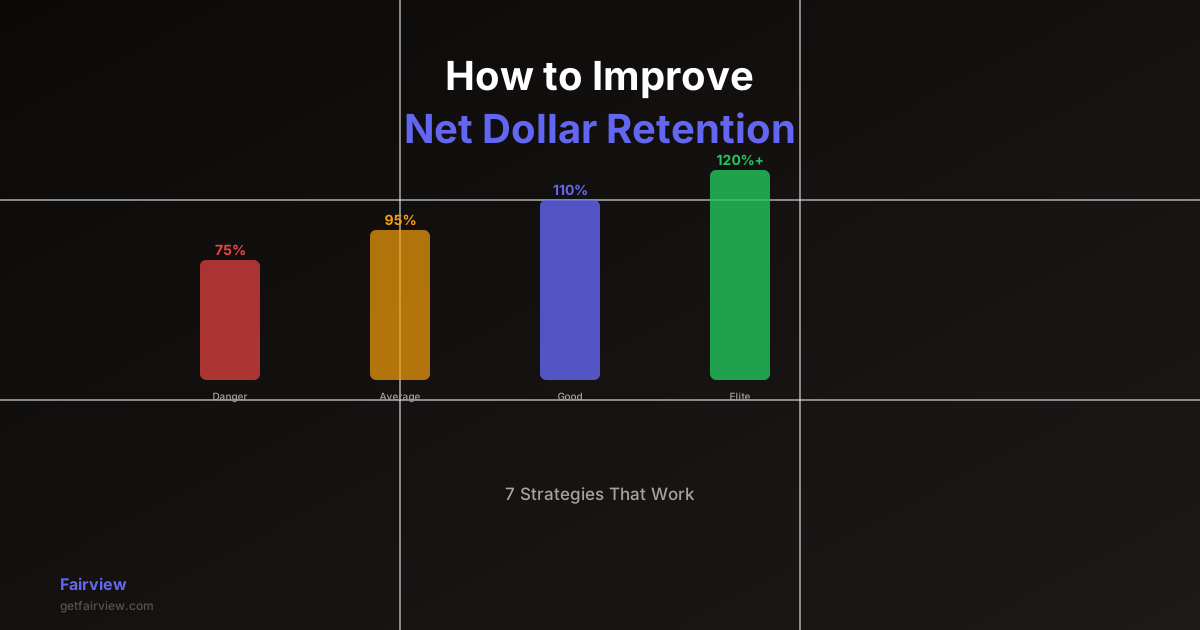
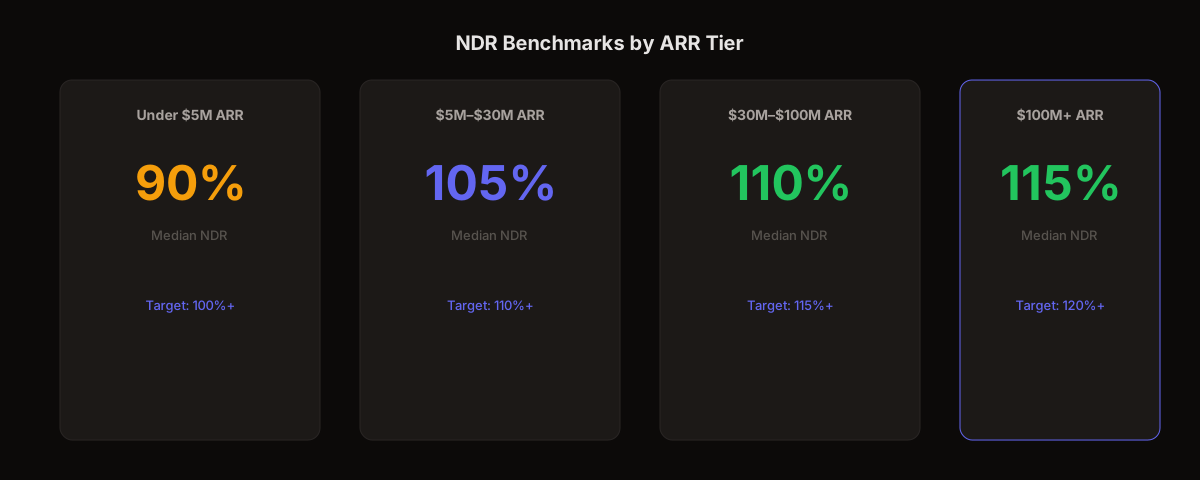
- • 110%+ NDR means your existing customer base grows revenue even without new sales.
- • The 7 strategies cover both churn reduction and expansion revenue — both sides of the NDR equation.
- • Contraction (downgrades) is the most commonly overlooked NDR drag.
- • Tracking NDR by cohort reveals which customer segments retain and expand versus which shrink.
Net dollar retention is the metric that separates sustainable SaaS companies from ones that are burning new customer acquisition to offset customer losses. A company with 90% NDR loses 10% of its revenue base every year regardless of how much it spends on sales and marketing. A company with 120% NDR grows its existing revenue by 20% annually without closing a single new deal.
The math compounds quickly. Two companies with identical new ARR and identical burn rates diverge dramatically over 3 years if one has 95% NDR and the other has 115% NDR. By year 3, the higher-NDR company has 40% more total ARR from the same new business volume.
This guide covers how to improve net dollar retention with 7 strategies that address both sides of the equation: reducing churn and contraction, and systematically driving expansion.
How to Calculate Net Dollar Retention
NDR is calculated on a cohort basis. Take a group of customers at the start of a period and measure their revenue 12 months later.
Formula
NDR = (Starting MRR + Expansion MRR − Contraction MRR − Churned MRR) / Starting MRR × 100
If you start a January cohort with $500,000 MRR, expand it by $80,000, lose $20,000 to contraction, and lose $30,000 to churn — your NDR is ($500K + $80K − $20K − $30K) / $500K × 100 = 106%.
Note what NDR does not include: new customer revenue. Only the starting cohort is measured. This is what makes NDR a pure measure of customer success quality — new sales cannot inflate it.
Tracking net dollar retention alongside gross retention (which excludes expansion) tells you where your problem is. If gross retention is high but NDR is low, your expansion motion is broken. If gross retention is low, your churn and contraction problem is primary.
Strategy 1: Reduce Contraction Revenue
Most SaaS teams track churn closely but miss contraction. Contraction — customers who downgrade, negotiate lower prices, or reduce seat counts — can quietly drag NDR below 100% even when gross churn looks acceptable.
Identify contraction by pulling a cohort report that shows MRR movement for each customer over the trailing 12 months. Segment accounts that have contracted by 10%+ in value. For each segment, identify the pattern: was it a pricing negotiation, a seat reduction, or a plan downgrade?
The fix varies by cause. Pricing negotiation contraction usually means you have a sales or renewal team that discounts under pressure. Implement a discount approval policy and train renewal reps on value-based objection handling. Seat reduction contraction often means under-adoption — fix the adoption problem and seat counts stabilize. Plan downgrade contraction usually means a mismatch between the customer's use case and the plan they are on — which is often a sales qualification failure.
Reducing contraction by 5 percentage points has the same NDR impact as recovering 5 percentage points of gross churn, but it is usually cheaper and faster to address.
Strategy 2: Build a Structured Expansion Motion
Expansion revenue does not happen by accident. Companies with 115%+ NDR have a structured expansion playbook — defined triggers, assigned owners, and measurable targets for upsell and cross-sell.
The first step is identifying expansion triggers: moments in the customer lifecycle where upgrade intent is highest. Common triggers include hitting a usage limit (seats, API calls, data volume), reaching a milestone in feature adoption, the 90-day mark of a new customer relationship, and annual renewal conversations.
Assign ownership. CSMs should own expansion conversations with existing accounts; they have the relationship. AEs typically handle large upsell deals where a formal sales cycle is warranted. The handoff between CSM and AE should be explicit — set a deal size threshold (e.g., $10,000+ ACV triggers an AE handoff) and a process for the transition.
Set a quarterly expansion quota per CSM alongside their retention quota. Teams without an expansion quota treat expansion as optional — and it shows in NDR. A typical target: expansion MRR equivalent to 15-20% of the CSM's book value per year.
See Your NDR Broken Down by Cohort
Fairview surfaces expansion, contraction, and churn by customer segment — so you know exactly where NDR is leaking. Stop spending Monday mornings in spreadsheets.
Book a Demo →Strategy 3: Implement Usage-Based Pricing Where It Fits
Flat-rate pricing caps expansion. If a customer pays $5,000/year regardless of usage, there is no natural expansion lever — you have to create a reason for them to upgrade. Usage-based pricing (UBP) solves this by automatically expanding revenue as customers derive more value.
The data supports this. SaaS companies with usage-based components in their pricing consistently report higher NDR than flat-rate peers. This is structural: usage-based pricing aligns revenue with value delivery. As customers scale on your platform, revenue scales with them.
Usage-based pricing does not mean fully variable pricing. The most common model for B2B SaaS is a base platform fee plus usage-based components — seats, API calls, records processed, or data volume. This gives customers a predictable minimum cost while creating natural expansion vectors as they grow.
If switching to pure UBP is not feasible, add usage-based add-ons to your current plans. Feature add-ons, advanced seats, or data capacity tiers all create expansion revenue without requiring a full pricing overhaul.
Strategy 4: Build a Proactive Early Warning System
The best time to prevent churn is 90 days before the cancellation request. At that point, the customer has mentally already left — you are fighting for recovery. An early warning system surfaces risk signals 90 to 180 days before renewal, when intervention actually changes outcomes.
Build a health score for each customer that aggregates the signals most correlated with churn in your customer base. The specific signals vary by product, but typically include: product login frequency (declining = risk), feature adoption depth (shallow = risk), support ticket volume (spiking = risk), NPS score (below 7 = risk), and days since last meaningful CSM interaction (more than 60 = risk).
A customer health score is only as useful as the intervention it triggers. Map health score thresholds to specific actions: score below 60 triggers immediate CSM outreach; score below 40 triggers executive business review; score below 20 triggers a save play with executive-level involvement from both sides.
Without a health score, CSMs manage by squeaky wheel — spending time on the loudest customers rather than the ones most at risk. The result is predictable: churn surprises that were completely visible in the data, to anyone who was looking.
Strategy 5: Operationalize the Renewal Process
Renewal is not a moment — it is a process that starts 120 days before the contract end date. Companies that run renewal as a last-minute conversation lose deals they could have kept and leave expansion on the table.
A structured renewal process looks like this: 120 days out, CSM conducts a success review — documenting outcomes achieved against the original business case. 90 days out, CSM presents the renewal proposal, including recommended expansion options. 60 days out, legal and procurement review begins if required. 30 days out, signature is the target. Anything later than 14 days before renewal risks a lapse.
The renewal conversation should lead with value delivered, not with the invoice. Build a success summary that quantifies what the customer has achieved using your product. This reframes renewal from a cost discussion to an investment decision, which is the right frame for retention and expansion alike.
Track renewal forecast accuracy alongside NDR. If your CSMs forecast 90% renewal rate but you close at 75%, the forecast process is broken — not just the retention. Accurate forecasting requires honest health assessment, which is why health scores and renewal forecasting belong in the same system.
Strategy 6: Segment Your Customer Base by NDR Contribution
Not all customers contribute equally to NDR. In most SaaS companies, 20% of accounts contribute 80% of expansion revenue, and a different 20% account for most churn and contraction. Understanding which segment does what changes how you allocate CS resources.
Run a cohort analysis that calculates NDR by customer segment: by ARR tier, by industry, by acquisition channel, by product tier, by implementation type. The patterns this reveals are almost always actionable. For example: enterprise customers acquired through inbound may have 130% NDR, while SMB customers acquired through a trial-to-paid motion may have 85% NDR. That finding has immediate implications for sales qualification, pricing, and resource allocation.
Use this segmentation to make resource allocation decisions. If your $50K+ ARR accounts have 125% NDR and your under-$10K accounts have 88% NDR, disproportionately investing in large account CS coverage will improve overall NDR faster than even-handed coverage.
This segmentation work is related to LTV:CAC ratio analysis by segment — the segments with the best NDR tend to have the highest LTV and justify higher CAC.
Strategy 7: Fix Onboarding to Improve Long-Term NDR
The first 90 days of a customer relationship determine NDR 12 months later. Customers who achieve their first value milestone within 30 days of signing show materially higher 12-month retention than those who do not. This is not correlation — it is causal. Early activation creates the habit, the internal advocacy, and the organizational buy-in that makes renewal straightforward.
Audit your current time-to-first-value by segment. For each customer, identify the first moment they achieved an outcome they signed up for — not just logged in, but actually got value. Calculate the average days-to-first-value across your cohort, then calculate the correlation between days-to-first-value and 12-month NDR.
The most common onboarding failures: no defined success milestone for the first 30 days, CSM handoff from sales that loses customer context, onboarding checklist that measures activity (calls held, emails sent) rather than outcomes (features activated, integrations connected, first report generated).
Redesign onboarding around milestones, not activities. Define 3 to 5 outcomes that constitute "activated" for each product tier. Build onboarding playbooks that drive customers to those milestones in the first 30 days. Measure activation rate (percentage of new customers who hit all milestones within 30 days) as a leading indicator of NDR 12 months later.
How Fairview Tracks NDR
Fairview's Operating Dashboard connects your CRM (HubSpot, Salesforce, or Pipedrive) with your billing data (Stripe, QuickBooks, or Xero) to surface NDR, gross retention, expansion MRR, and contraction MRR in one view — updated automatically.
The Pipeline Health Monitor surfaces accounts showing early warning signals — usage decline, support spikes, reduced login frequency — before they churn. The Next-Best Action Engine then recommends the specific intervention most likely to retain each at-risk account based on their profile and the patterns in your historical data.
The Weekly Operating Report delivers NDR movement, expansion pipeline, and at-risk account alerts every Monday. No spreadsheet rebuilding, no manual cohort analysis — just the numbers and the actions. Book a demo to see it →
What is the difference between NDR and NRR?
Net Dollar Retention (NDR) and Net Revenue Retention (NRR) measure the same thing: the percentage of recurring revenue retained from a cohort of existing customers over a period, including expansion, contraction, and churn. The terms are interchangeable in practice.
How do you calculate net dollar retention?
NDR = (Starting MRR + Expansion MRR - Contraction MRR - Churned MRR) / Starting MRR x 100. Measure it on a 12-month cohort basis for the most accurate view. Monthly snapshots can be distorted by timing of expansions and cancellations.
What is the fastest way to improve NDR?
The fastest lever is reducing contraction — customers who downgrade or negotiate lower prices. Contraction is often invisible in dashboards that only track churn. Identify accounts that have contracted in the past 12 months, understand the cause, and address it systematically.
How does NDR affect SaaS valuation?
NDR has a direct impact on ARR growth and thus on revenue multiples. A company with 120% NDR grows its existing revenue base by 20% per year without adding a single new customer. Investors applying a 10x ARR multiple to that baseline see significant compounding value from NDR improvement.
Key Takeaways
- Net dollar retention captures both churn reduction and expansion — tracking only one side gives an incomplete picture.
- Contraction (downgrades and price reductions) is the most overlooked drag on NDR and often easier to fix than gross churn.
- Usage-based pricing components create natural expansion vectors that lift NDR structurally.
- Early warning systems and proactive renewal processes prevent churn — reactive save plays are expensive and less effective.
- Segment NDR by customer tier to identify where to invest CS resources for maximum NDR impact.
Know what is making money, what is leaking margin, and what to do next. Start your free trial →