TL;DR
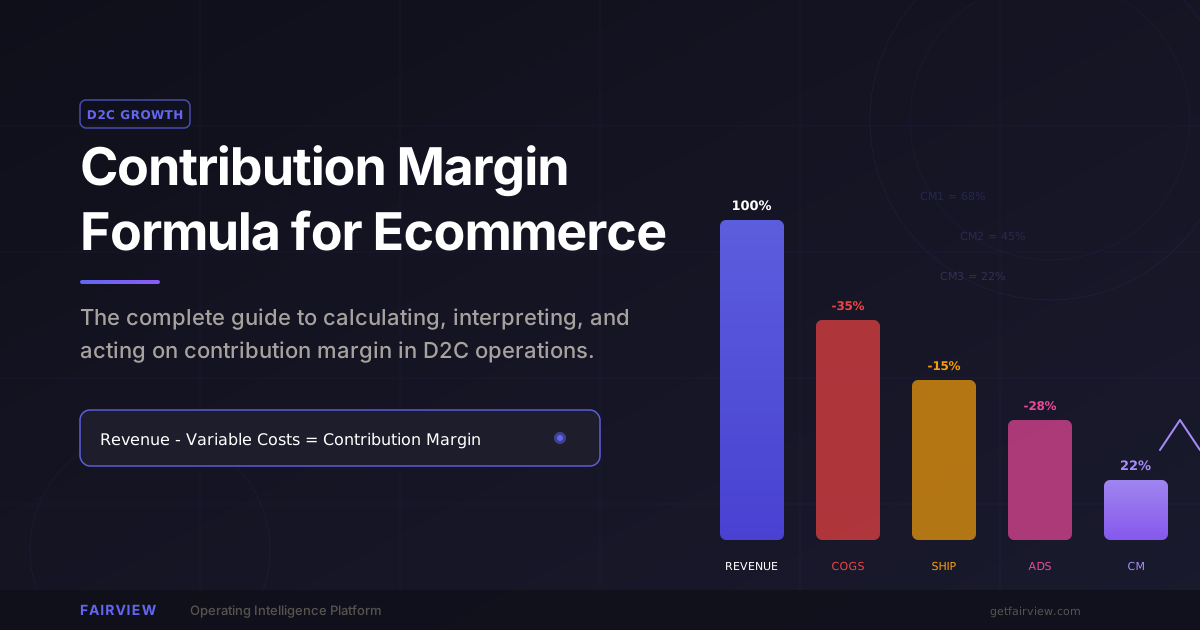
- The formula: Contribution Margin equals Revenue minus all variable costs. Variable costs include COGS, payment processing, shipping, returns, and marketing. Not just COGS. The brands that calculate it fully make better decisions than the ones that stop at gross margin.
- Three layers: CM1 (revenue minus COGS and payment fees), CM2 (minus fulfillment and returns), CM3 (minus marketing). CM3 is the metric that matters for operating decisions. Most D2C brands track CM1 and wonder why they run out of cash.
- Benchmarks by vertical: Supplements 20% to 35% CM3. Beauty 18% to 30%. Fashion 10% to 20%. Food and beverage 8% to 18%. Electronics 5% to 15%. Below 10% CM3 means you are scaling losses, not growth.
- Per-unit, per-order, per-channel: Calculate contribution margin at all three levels. Per-unit tells you which SKUs to keep. Per-order tells you which bundles work. Per-channel tells you where to spend the next ad dollar.
- Weekly discipline: A 30-minute weekly contribution margin review catches margin drift in 7 days. The operators who review weekly adjust before the quarter ends. The ones who review monthly explain what went wrong.
Most ecommerce brands know their gross margin. Fewer know their contribution margin. The difference is not academic. It is the difference between a brand that scales profitably and a brand that scales into insolvency. Gross margin tells you if your product is profitable. Contribution margin tells you if your business model is profitable. One ignores marketing, shipping, and returns. The other accounts for every variable cost that moves with revenue.
This guide covers the contribution margin formula for ecommerce in full: the three calculation layers, the five variable cost buckets most brands miss, benchmarks by vertical and revenue stage, worked examples for per-unit and per-channel analysis, and the weekly tracking method that keeps margin honest. If you operate a D2C brand and want to know which products, orders, and channels actually make money, this is the operating framework.
What is contribution margin?
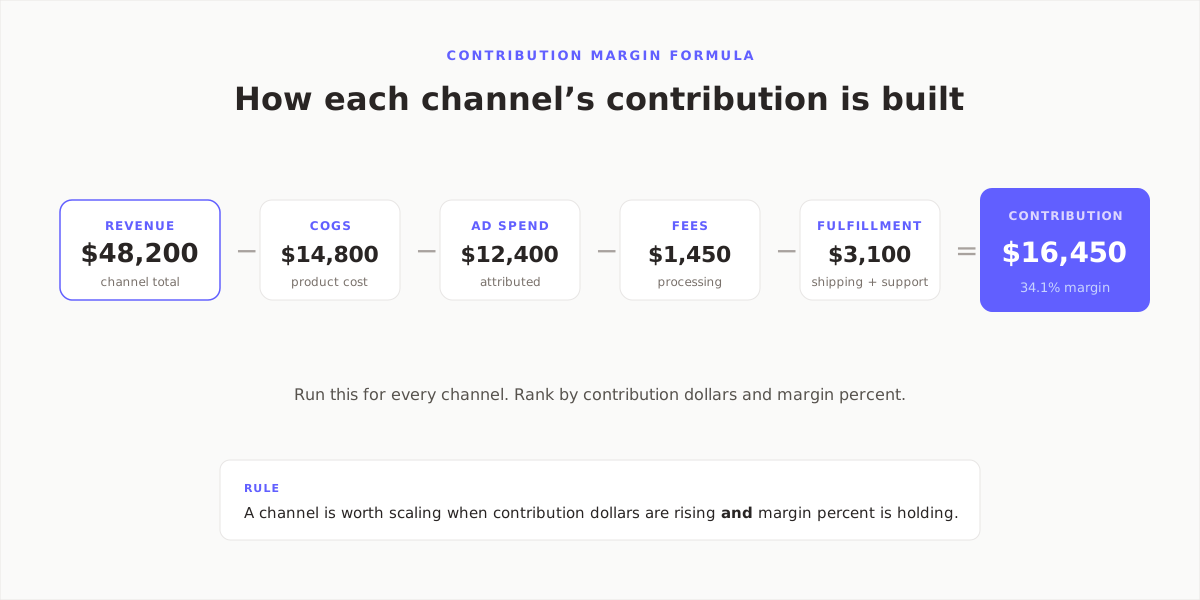
Contribution margin is revenue minus all variable costs associated with generating that revenue. Variable costs are costs that increase directly with each additional unit sold. In ecommerce, these include COGS, payment processing, shipping, returns processing, and variable marketing spend.
The word "contribution" matters. This metric shows how much each sale contributes toward covering fixed costs and generating profit. If contribution margin is positive, each sale brings the business closer to break-even and then to profit. If contribution margin is negative, each sale deepens the loss. A brand with negative contribution margin and high revenue is not growing. It is accelerating its own failure.
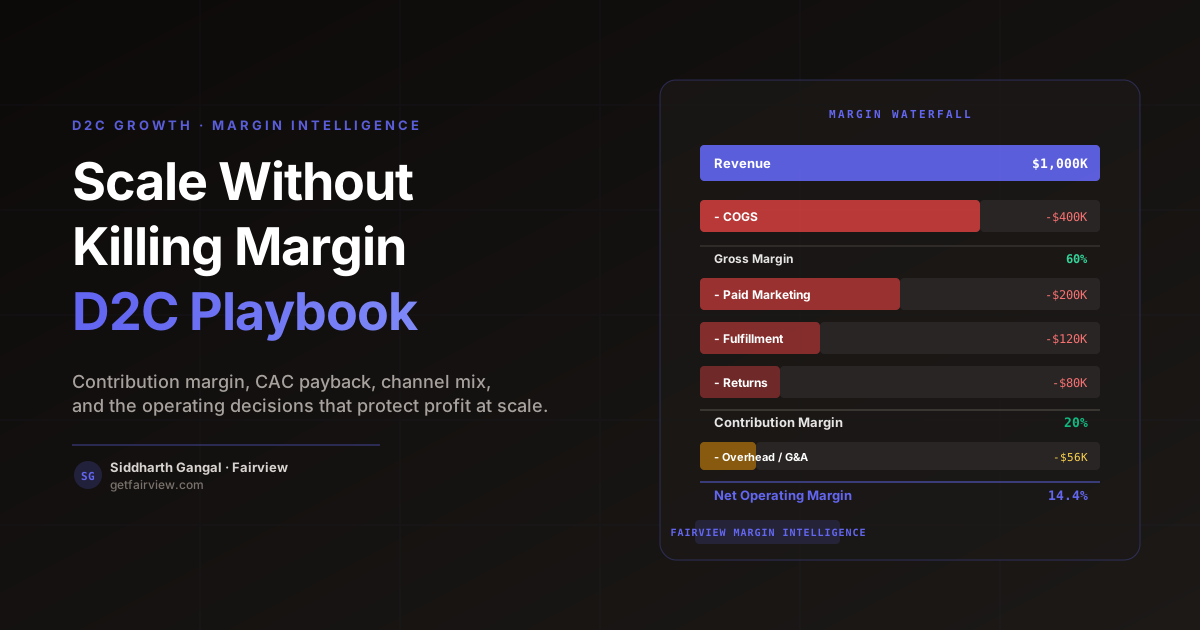
Gross margin, by contrast, is revenue minus COGS only. It is a manufacturing metric applied to retail. It tells you whether the product itself is profitable before any costs of selling, shipping, or marketing. For ecommerce, gross margin is necessary but not sufficient. A brand with 70% gross margin can still lose money on every order if shipping costs 15%, payment processing costs 3%, returns cost 12%, and marketing costs 45%.
Definition
Contribution margin is revenue minus all variable costs that increase with each unit sold. In ecommerce, variable costs include COGS, payment processing, fulfillment and shipping, returns, and marketing. It is the dollars available to cover fixed overhead and generate profit. Gross margin is a subset of contribution margin, not a substitute.
The reason this distinction matters is that most ecommerce operators optimize for the wrong metric. They track gross margin in their Shopify dashboard, celebrate 65% or 70% numbers, and scale ad spend based on platform-reported ROAS. They do not account for the fact that returns destroy 15% to 25% of revenue in fashion, that shipping eats 10% to 18% in home goods, or that Meta CPMs have risen 40% to 60% since 2021. The result is a brand that looks healthy on gross margin and bleeds cash on contribution margin.
For a complete walkthrough of how to track profit beyond gross margin, see the guide on margin intelligence.
The three-layer contribution margin framework
Contribution margin is not a single number. It is a stack of three numbers, each revealing a different layer of the business. The operators who manage margin well calculate all three and know which one to prioritize at each decision point.
CM1: Product-level margin
CM1 is revenue minus COGS and payment processing fees. It answers the question: is the product itself profitable before any costs of fulfillment, returns, or marketing?
CM1 = Revenue - COGS - Payment Processing Fees
COGS for ecommerce includes the product cost, packaging materials, inbound freight from manufacturer to warehouse, duties and tariffs, and any product-specific licensing or compliance costs. Payment processing fees are typically 2.5% to 3.5% of revenue, depending on the processor and card mix.
CM1 is the metric product teams and buyers care about. It tells you whether a SKU is worth carrying at all. A SKU with negative CM1 should not exist in your catalog. A SKU with 15% CM1 is a candidate for cost reduction or price increase. A SKU with 50% CM1 is a hero product worth promoting.
CM2: Fulfillment-adjusted margin
CM2 is CM1 minus fulfillment, outbound shipping, and returns processing. It answers the question: after the product is made and the customer receives it, what is left?
CM2 = CM1 - Fulfillment - Outbound Shipping - Returns Processing
Fulfillment includes 3PL pick-and-pack fees, warehouse storage, and kitting or bundling costs. Outbound shipping is the carrier cost to deliver the order to the customer. Returns processing includes return shipping, restocking, inspection, and disposal of damaged goods.
CM2 is the metric operations teams care about. It reveals whether your logistics stack is efficient or bleeding margin. A brand with 60% CM1 and 35% CM2 has a 25-point logistics gap. That gap might come from high shipping costs on low-AOV orders, a 3PL with excessive per-unit fees, or a return rate that destroys margin on certain SKUs.
The return rate component deserves special attention. The average ecommerce return rate in 2026 is 14% for DTC brands and 19% overall, up from 11% in 2020. In fashion and apparel, return rates reach 25% to 40%. Every returned order incurs outbound shipping, return shipping, restocking labor, and potential inventory damage. A brand with 30% return rate and $50 AOV is effectively losing $15 per order to returns before marketing costs are applied.
CM3: Marketing-adjusted margin
CM3 is CM2 minus all variable marketing spend. It is the true operating margin of the ecommerce business. It answers the question: after making the product, delivering it, and acquiring the customer, what is left to cover fixed costs and generate profit?
CM3 = CM2 - Ad Spend - Agency Fees - Affiliate Commissions - Influencer Payments
CM3 is the metric founders and CFOs care about. It is the number that determines whether the business is viable. A positive CM3 means each sale brings the business closer to covering fixed costs. A negative CM3 means the business loses money on every transaction regardless of scale.
The 20% CM3 rule is the benchmark most operators use. Below 10% CM3 means the brand is scaling losses. Between 10% and 20% is survivable but leaves no buffer for CPM increases or seasonal slowdowns. Above 20% is healthy. Above 25% provides room to outspend competitors on acquisition while maintaining profitability. Top-performing supplement and beauty brands achieve 25% to 35% CM3.
The five variable cost buckets
Most brands miscalculate contribution margin because they miss variable costs. They subtract COGS and ad spend and call it done. Here are the five buckets that belong in the calculation and the rules for what to include in each.
1. COGS (Cost of Goods Sold)
Include: product manufacturing or wholesale cost, packaging materials, inbound freight from supplier to warehouse, duties and tariffs, product-specific compliance or testing costs, and packaging inserts or printed materials.
Do not include: warehouse rent (fixed), salaries (fixed), software subscriptions (fixed), or marketing creative production (marketing, not COGS). A common mistake is including warehouse labor in COGS. Warehouse labor is a fixed cost unless you pay per unit picked. Most 3PLs charge per unit, which makes fulfillment a variable cost — but that belongs in the fulfillment bucket, not COGS.
For a detailed breakdown of what belongs in ecommerce COGS, see the guide on COGS tracking for ecommerce.
2. Payment Processing
Include: credit card processing fees, PayPal or Shop Pay fees, buy-now-pay-later fees (Afterpay, Klarna, Affirm), chargeback fees, and currency conversion fees for international orders.
Payment processing is typically 2.5% to 3.5% of revenue. On a $100 order, that is $2.50 to $3.50. On $1M annual revenue, that is $25,000 to $35,000. It is not optional. It scales directly with revenue. It belongs in contribution margin.
3. Fulfillment and Shipping
Include: 3PL pick-and-pack fees per order, per-unit storage fees, outbound shipping to customer, packaging materials not included in COGS, and kitting or bundling labor.
Shipping is the most variable of variable costs. It changes by order weight, destination zone, carrier rates, and fuel surcharges. A brand shipping from one warehouse to customers across the United States might pay $4.50 per order on average but $8.00 for West Coast orders and $3.50 for East Coast orders. Averaging these masks the true cost per order. The operators who track margin well calculate shipping by zone and adjust pricing or warehouse placement accordingly.
4. Returns
Include: return shipping labels, restocking labor, inspection and repackaging, disposal of damaged or unsellable inventory, and refund processing fees.
Returns are a hidden margin killer because most brands do not track them as a cost category. They record the revenue reversal in accounting but do not allocate the associated costs. A $100 order with a $30 product cost, $8 shipping, and $5 return processing costs the brand $43 when returned — not just the $30 product cost. The $13 in shipping and processing is real cash out the door.
Calculate a returns reserve: average return rate times average cost per return. Apply this reserve to every order at the time of sale. A brand with 20% return rate and $15 average return cost should reserve $3 per order. This gives a more accurate contribution margin than calculating returns after they happen.
5. Variable Marketing
Include: paid ad spend (Meta, Google, TikTok, Pinterest, programmatic), agency management fees tied to ad spend, affiliate commissions, influencer payments tied to sales or codes, and promotional discounts.
Do not include: brand marketing spend not tied to direct response (hard to attribute and mostly fixed), organic social media management (fixed labor cost), SEO content production (fixed), or email marketing platform fees (fixed subscription).
The distinction between variable and fixed marketing matters. A brand spending $50K per month on Meta Ads with a 15% agency fee has $57,500 in variable marketing. A brand spending $5K per month on a content agency has a fixed cost. Only the former belongs in contribution margin.
Contribution margin benchmarks by vertical
Contribution margin varies significantly by product category. A supplement brand with 85% gross margin and low return rates operates in a different margin universe than a fashion brand with 55% gross margin and 30% returns. The table below shows realistic CM1, CM2, and CM3 ranges based on 2026 data from DTC operators across categories.
| Vertical | CM1 Range | CM2 Range | CM3 Range | Key Driver |
|---|---|---|---|---|
| Supplements and Health | 70% - 84% | 50% - 65% | 20% - 35% | High repeat rate, low returns, subscription-friendly |
| Beauty and Skincare | 60% - 80% | 50% - 70% | 18% - 30% | Premium pricing, low return rates (4% to 10%) |
| Subscription (any category) | 50% - 75% | 35% - 55% | 20% - 32% | Predictable revenue, 5% to 8% monthly churn |
| Pet Care | 40% - 65% | 30% - 45% | 15% - 28% | High repeat rate, subscription-friendly |
| Fashion and Apparel | 45% - 68% | 30% - 50% | 10% - 20% | Returns destroy 20% to 30% of revenue |
| Home Goods and Furniture | 40% - 56% | 25% - 40% | 8% - 18% | Freight is 10% to 18% of revenue |
| Food and Beverage | 30% - 55% | 20% - 35% | 8% - 18% | Cold chain, perishability, low AOV |
| Consumer Electronics | 15% - 41% | 15% - 28% | 5% - 15% | Low repeat, infrequent purchase, high support |
These ranges are directional, not prescriptive. A supplement brand with 65% gross margin and poor retention might achieve 12% CM3. A fashion brand with 60% gross margin and a 10% return rate might achieve 22% CM3. The right benchmark for your brand depends on your specific cost structure, not industry averages.
Two patterns are worth noting. First, the gap between CM1 and CM3 is widest in categories with high marketing intensity and high logistics costs. Fashion brands lose 25 to 35 points between CM1 and CM3. Supplement brands lose 20 to 30 points. The operators who close this gap do so by reducing return rates, negotiating shipping rates, and improving marketing efficiency — not by squeezing suppliers on product cost.
Second, public DTC brands show a median net profit margin of just 0.2% as of early 2026, with a range from negative 7.4% to positive 14.2%. The median operating margin is 1.6%. These numbers are after fixed costs, but they illustrate how thin DTC profitability is at scale. A brand with 15% CM3 and 20% fixed cost ratio is losing 5% at the bottom line. The path to profitability is either raising CM3 or reducing fixed costs. Most operators focus on the wrong one.
Worked example: per-unit contribution margin
Theory is useful. Numbers are better. Here is a worked example of contribution margin per unit for a D2C skincare brand selling a $48 moisturizer.
| Line Item | Amount | % of Revenue | Notes |
|---|---|---|---|
| Selling Price | $48.00 | 100% | Listed price before discounts |
| Less: Discount | -$4.80 | -10% | First-order promotion |
| Net Revenue | $43.20 | 90% | Actual revenue recognized |
| Less: COGS | -$12.96 | -30% | Product, packaging, inbound freight |
| Less: Payment Processing | -$1.30 | -3% | Stripe at 3% |
| CM1 | $28.94 | 67% | Product-level margin |
| Less: Fulfillment | -$3.46 | -8% | 3PL pick and pack |
| Less: Shipping | -$5.18 | -12% | Ground shipping, zone 5 |
| Less: Returns Reserve | -$1.73 | -4% | 8% return rate at $21.60 cost |
| CM2 | $18.57 | 43% | Fulfillment-adjusted margin |
| Less: Ad Spend | -$12.96 | -30% | Meta and Google blended |
| Less: Agency Fee | -$1.94 | -4.5% | 15% of ad spend |
| CM3 | $3.67 | 8.5% | Contribution margin |
This brand has a problem. CM3 of 8.5% is below the 10% survival threshold. At $43.20 net revenue, the brand keeps $3.67 per unit after all variable costs. If fixed costs are $20,000 per month, the brand needs to sell 5,450 units per month just to break even. At current marketing efficiency, that requires $157,000 in monthly ad spend.
The fix depends on which lever has the most room. The discount is 10% — can it be reduced to 5%? Shipping is 12% — can a second warehouse on the West Coast reduce zone 5 shipments? Ad spend is 30% of net revenue — can landing page improvements or creative testing reduce CPA by 20%? Each of these moves raises CM3. The operator who identifies the biggest gap and fixes it first wins.
Worked example: per-channel contribution margin
Per-unit margin tells you which SKUs to keep. Per-channel margin tells you where to spend the next ad dollar. Here is the same skincare brand, split by acquisition channel.
| Metric | Meta Ads | Google Ads | Organic Search | |
|---|---|---|---|---|
| Monthly Revenue | $25,000 | $18,000 | $8,000 | $12,000 |
| Net Revenue (after discounts) | $22,500 | $16,200 | $7,600 | $11,400 |
| COGS | -$6,750 | -$4,860 | -$2,280 | -$3,420 |
| Payment Processing | -$675 | -$486 | -$228 | -$342 |
| CM1 | $15,075 | $10,854 | $5,092 | $7,638 |
| Fulfillment and Shipping | -$4,500 | -$3,240 | -$1,520 | -$2,280 |
| Returns Reserve | -$900 | -$648 | -$304 | -$456 |
| CM2 | $9,675 | $6,966 | $3,268 | $4,902 |
| Ad Spend / Acquisition Cost | -$8,500 | -$4,200 | -$0 | -$200 |
| Agency / Platform Fees | -$1,275 | -$630 | -$0 | -$0 |
| CM3 | -$100 | $2,136 | $3,268 | $4,702 |
| CM3 % | -0.4% | 11.9% | 40.9% | 39.2% |
This table reveals what platform dashboards hide. Meta Ads shows $25,000 in revenue and what appears to be healthy ROAS. But after fully loaded costs, Meta is losing $100 per month. Google Ads is profitable at 11.9% CM3. Organic search and email are the stars at 40% plus CM3 — but they are not scalable on demand.
The decision is not to cut Meta entirely. It is to fix Meta or reallocate. Options: reduce Meta ad spend by 30% and test tighter audiences, increase email capture rate to convert more Meta traffic to the high-CM3 email channel, or shift some Meta budget to Google where CM3 is positive. The operator who makes this decision using per-channel contribution margin makes a better decision than the one using platform-reported ROAS.
For the full method of calculating channel-level profitability, see the guide on how to calculate contribution margin by channel.
How to calculate break-even ROAS from contribution margin
Break-even ROAS is the return on ad spend at which a campaign generates zero contribution margin. It is not the same as break-even on revenue. A campaign with 2.0x ROAS might be profitable for a supplement brand and catastrophic for a fashion brand. The difference is contribution margin.
The formula is simple:
Break-Even ROAS = 1 / Contribution Margin Ratio
Where contribution margin ratio is CM3 as a percentage of net revenue. If CM3 is 25% of net revenue, break-even ROAS is 4.0x. If CM3 is 15%, break-even ROAS is 6.7x. If CM3 is 10%, break-even ROAS is 10.0x.
Here is the break-even ROAS by vertical using the CM3 ranges from the benchmark table:
| Vertical | Avg CM3 | Break-Even ROAS | Target ROAS (20% profit) |
|---|---|---|---|
| Supplements | 27% | 3.7x | 4.5x |
| Beauty and Skincare | 24% | 4.2x | 5.0x |
| Subscription | 26% | 3.8x | 4.6x |
| Pet Care | 21% | 4.8x | 5.7x |
| Fashion and Apparel | 15% | 6.7x | 8.0x |
| Home Goods | 13% | 7.7x | 9.2x |
| Food and Beverage | 13% | 7.7x | 9.2x |
| Consumer Electronics | 10% | 10.0x | 12.0x |
A fashion brand operating at 6.0x ROAS thinks it is profitable because the number looks healthy. But with 15% CM3, the brand needs 6.7x just to break even. At 6.0x, every dollar of ad spend loses money. The brand scales revenue and deepens losses simultaneously. This is how D2C brands fail while growing.
The target ROAS column adds a 20% profit margin on top of break-even. This is the number to optimize for, not break-even. A supplement brand with 3.7x break-even should target 4.5x. A fashion brand with 6.7x break-even should target 8.0x. These targets are impossible in some categories at some stages. That is useful information. It tells you whether your category and cost structure support paid acquisition at scale.
Common mistakes when calculating contribution margin
Most ecommerce brands do not fail because they lack data. They fail because they calculate the wrong numbers. Here are the six most common mistakes operators make with contribution margin.
Mistake 1: Stopping at gross margin
Gross margin is easy to calculate and dangerous to trust. Shopify shows it automatically. It ignores shipping, returns, payment fees, and marketing. A brand with 65% gross margin and negative contribution margin is not rare. It is the default state for brands that scale on platform-reported ROAS without fully loaded cost accounting.
The correction: calculate CM3 for every product, every order, and every channel. Do not make decisions based on gross margin alone.
Mistake 2: Ignoring returns
Returns are not a post-sale event. They are a cost of doing business that should be reserved at the time of sale. A brand with 20% return rate that does not reserve for returns is overstating contribution margin by 15% to 20%. When returns come in, the margin disappears retroactively.
The correction: calculate a returns reserve based on trailing 90-day return rate by SKU. Apply it to every order at the time of revenue recognition.
Mistake 3: Using blended averages
Blended contribution margin across all products and channels is easy to calculate and misleading to trust. It masks the fact that 30% of SKUs generate 80% of contribution margin while 50% of SKUs lose money. It masks the fact that organic search is highly profitable while paid social is break-even.
The correction: calculate contribution margin at the SKU level, the channel level, and the campaign level. Kill or fix the losers. Double down on the winners.
Mistake 4: Treating fixed costs as variable
Some brands include warehouse rent, salaries, or software subscriptions in contribution margin. These are fixed costs. They do not change with each additional unit sold. Including them in contribution margin understates the metric and makes every product look unprofitable.
The correction: contribution margin includes only costs that increase directly with revenue. Fixed costs are subtracted after contribution margin to calculate operating profit. Keep the line clear.
Mistake 5: Using list price instead of net revenue
A product listed at $60 with a 20% first-order discount generates $48 in net revenue, not $60. Using list price in contribution margin calculations overstates margin by the discount percentage. For brands that discount heavily, this error alone can turn a negative contribution margin positive on paper.
The correction: use net revenue after discounts, refunds, and promotions. This is the cash that actually hits your account.
Mistake 6: Reviewing monthly instead of weekly
A monthly contribution margin review catches problems after 30 days of compounding. At $100K monthly revenue, a 5% margin drop costs $5,000 before you notice it. A weekly review catches the same drop on day 7, when the cost is $1,250 and the fix is a SKU pause or budget shift, not a crisis meeting.
The correction: run a 30-minute weekly contribution margin review. Calculate CM3 by channel and by top 20 SKUs. Flag anything that moves more than 10% week over week.
The weekly contribution margin review
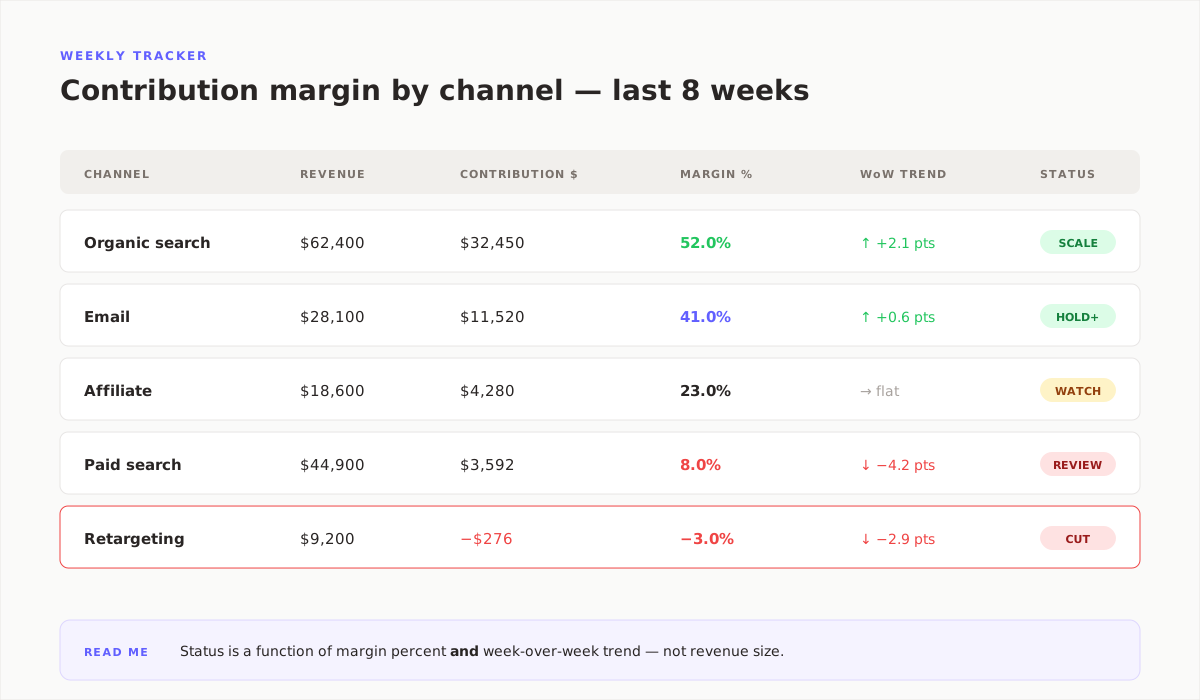
The brands that maintain healthy contribution margins share one habit: a structured weekly review that takes 30 minutes and covers margin by channel, by SKU, and by campaign. Not a dashboard check. A review with thresholds, owners, and actions.
The 30-minute structure
| Minute | Task | Owner | Threshold / Trigger |
|---|---|---|---|
| 0 - 5 | Check blended CM3 vs. prior week and target | COO or founder | CM3 below target by >10% = flag |
| 5 - 10 | Review CM3 by channel (paid, organic, email, wholesale) | Marketing lead | Any channel CM3 below 0% = immediate action |
| 10 - 15 | Review CM3 by top 20 SKUs | Product / ops | Any SKU CM3 below 5% = review pricing or costs |
| 15 - 20 | Check return rate by SKU vs. trailing 90-day average | Ops | Return rate up >20% vs. average = investigate |
| 20 - 25 | Review ad spend efficiency (CPA, ROAS, new customer CAC) | Marketing lead | CPA up >15% vs. 4-week average = flag |
| 25 - 30 | Assign actions, set owners, schedule follow-up | COO or founder | Every flagged item gets an owner and deadline |
The discipline is not the metrics. It is the threshold discipline. A metric that moves 3% week over week is noise. A metric that moves 15% is signal. The review exists to separate signal from noise and assign action before the signal compounds.
Three rules make this work. First, one person owns the review — usually the COO, founder, or a dedicated operations lead. Second, the review happens at the same time every week, before any budget changes or campaign launches. Third, every flagged item gets a named action and a deadline. A review that ends with "we should look into that" is not a review. It is a conversation.
For operators who want to extend this into a full operating rhythm, the weekly revenue cadence guide covers how to structure the broader Monday review that includes pipeline, forecast, and margin alongside contribution margin.
How Fairview tracks contribution margin
Fairview is an operating intelligence platform, not an accounting tool. It does not replace QuickBooks or Xero. It sits above those tools — connecting revenue data from Stripe and Shopify with cost data from accounting tools and ad spend data from marketing platforms — and answers the question those tools cannot: what is your true contribution margin by product, channel, and campaign?
Connecting the data
Fairview connects to Stripe, Shopify, QuickBooks, and Xero through its Data Connection Layer. It also connects to Google Ads, Meta Ads, and HubSpot Marketing Hub. The result is a single view where revenue from payment processors meets costs from accounting tools and ad spend from marketing platforms — without manual exports or spreadsheet reconciliation.
Margin Intelligence by SKU and channel
Fairview's Margin Intelligence feature calculates contribution margin by channel, campaign, and SKU — not just total revenue. It pulls cost data from QuickBooks or Xero, applies attribution logic to allocate ad spend, and shows CM1, CM2, and CM3 in one view. A campaign with 4x platform ROAS and 8% CM3 is flagged automatically. A SKU with 60% gross margin and negative CM3 due to high returns is surfaced for review.
The key outcome: companies recover an average of 23% of leaking margin in the first 90 days by identifying products, channels, and campaigns that look good on revenue metrics but lose money on contribution margin.
Next-Best Action for margin
When Fairview detects an anomaly in contribution margin — a CM3 drop on a specific channel, a return rate spike on a specific SKU, a shipping cost increase by zone — the Next-Best Action Engine generates a specific recommendation. Not a generic alert. A named action with an owner.
Examples of actions Fairview triggers:
- "Contribution margin on paid search dropped 18% this week. Review Google Ads spend by campaign."
- "Return rate on SKU-2847 reached 34%. Review product description and sizing guidance."
- "CM3 on Meta prospecting campaigns is negative. Shift 20% of budget to retargeting or email capture."
The Weekly Operating Report
Fairview generates a structured weekly report — delivered every Monday morning — that summarizes the prior week's contribution margin metrics alongside revenue, pipeline, and forecast data. The report highlights the top three anomalies or risks detected that week and lists open action items from prior weeks. Operators arrive at their Monday review already briefed, not building.
The honest scope: Fairview requires a finance integration (QuickBooks, Xero, or Stripe) to calculate full contribution margin. Without it, Fairview shows revenue and pipeline — not complete CM3. For brands that want true contribution margin tracking, the finance connection is essential.
Key takeaways
- Contribution margin is revenue minus all variable costs, not just COGS. The brands that calculate it fully make better decisions than the ones that stop at gross margin.
- Calculate three layers: CM1 (product-level), CM2 (fulfillment-adjusted), and CM3 (marketing-adjusted). CM3 is the metric that matters for operating decisions.
- Include all five variable cost buckets: COGS, payment processing, fulfillment and shipping, returns, and variable marketing. Missing any bucket overstates margin.
- Benchmarks vary by vertical. Supplements achieve 20% to 35% CM3. Fashion struggles at 10% to 20%. Below 10% CM3 means you are scaling losses.
- Calculate break-even ROAS from CM3, not gross margin. A fashion brand with 15% CM3 needs 6.7x ROAS to break even, not 2.0x.
- Run a 30-minute weekly contribution margin review. Calculate CM3 by channel and by top 20 SKUs. Flag anything that moves more than 10% week over week.
- Per-channel contribution margin reveals what platform dashboards hide. A channel with 4x platform ROAS and negative CM3 is a channel to fix or cut.
If you are ready to track contribution margin with real cost data — not platform dashboards or gross margin alone — Fairview connects your payment processor, ecommerce platform, accounting tools, and ad platforms into one operating view. See CM3 by channel, campaign, and SKU. Get specific recommendations when margin drifts. Book a demo to see how it works for your brand.
What is a good contribution margin for a D2C brand?
A healthy contribution margin (CM3) for D2C brands is 20% or higher. Beauty and skincare brands typically achieve 18% to 30%. Supplements and subscription brands reach 20% to 35%. Fashion and apparel brands struggle at 10% to 20% due to high return rates. Food and beverage brands average 8% to 18%. Below 10% CM3 means the brand is scaling losses. Above 25% provides room to outspend competitors on acquisition while maintaining profitability.
How do you calculate contribution margin per unit in ecommerce?
Contribution margin per unit equals the selling price of one unit minus all variable costs to produce, fulfill, and sell that unit. The formula is: Unit Selling Price minus Unit COGS (product, packaging, inbound freight) minus Payment Processing (2.5% to 3.5% of price) minus Shipping and Fulfillment minus Returns Reserve (return rate times cost of returned item) minus Variable Marketing (ad spend divided by units sold). This gives the exact profit contribution of each SKU before fixed costs.
What is the difference between gross margin and contribution margin?
Gross margin is revenue minus COGS only. It measures product profitability before operating costs. Contribution margin is revenue minus all variable costs — COGS, shipping, payment fees, returns, and marketing. It measures how much each sale contributes to covering fixed costs and generating profit. A brand can have 70% gross margin and negative contribution margin if marketing and shipping costs exceed the remaining 30%. Gross margin answers whether the product is profitable. Contribution margin answers whether the business model is profitable.
How often should ecommerce brands calculate contribution margin?
Weekly. A weekly contribution margin review takes 30 minutes and covers margin by channel, by SKU, and by campaign. Calculating monthly misses drift that compounds. At $100K monthly revenue, a 5% margin drop costs $5,000 before you notice it. A weekly review catches the same drop on day 7, when the fix is a budget shift or a SKU pause, not a crisis meeting. The operators who maintain healthy margins review weekly. The ones who discover problems at quarter-end review monthly.