TL;DR
- The formula: CAC Payback Period = Sales and Marketing Spend / (New ARR x Gross Margin %). The result tells you how many months it takes to recover the cost of acquiring a customer.
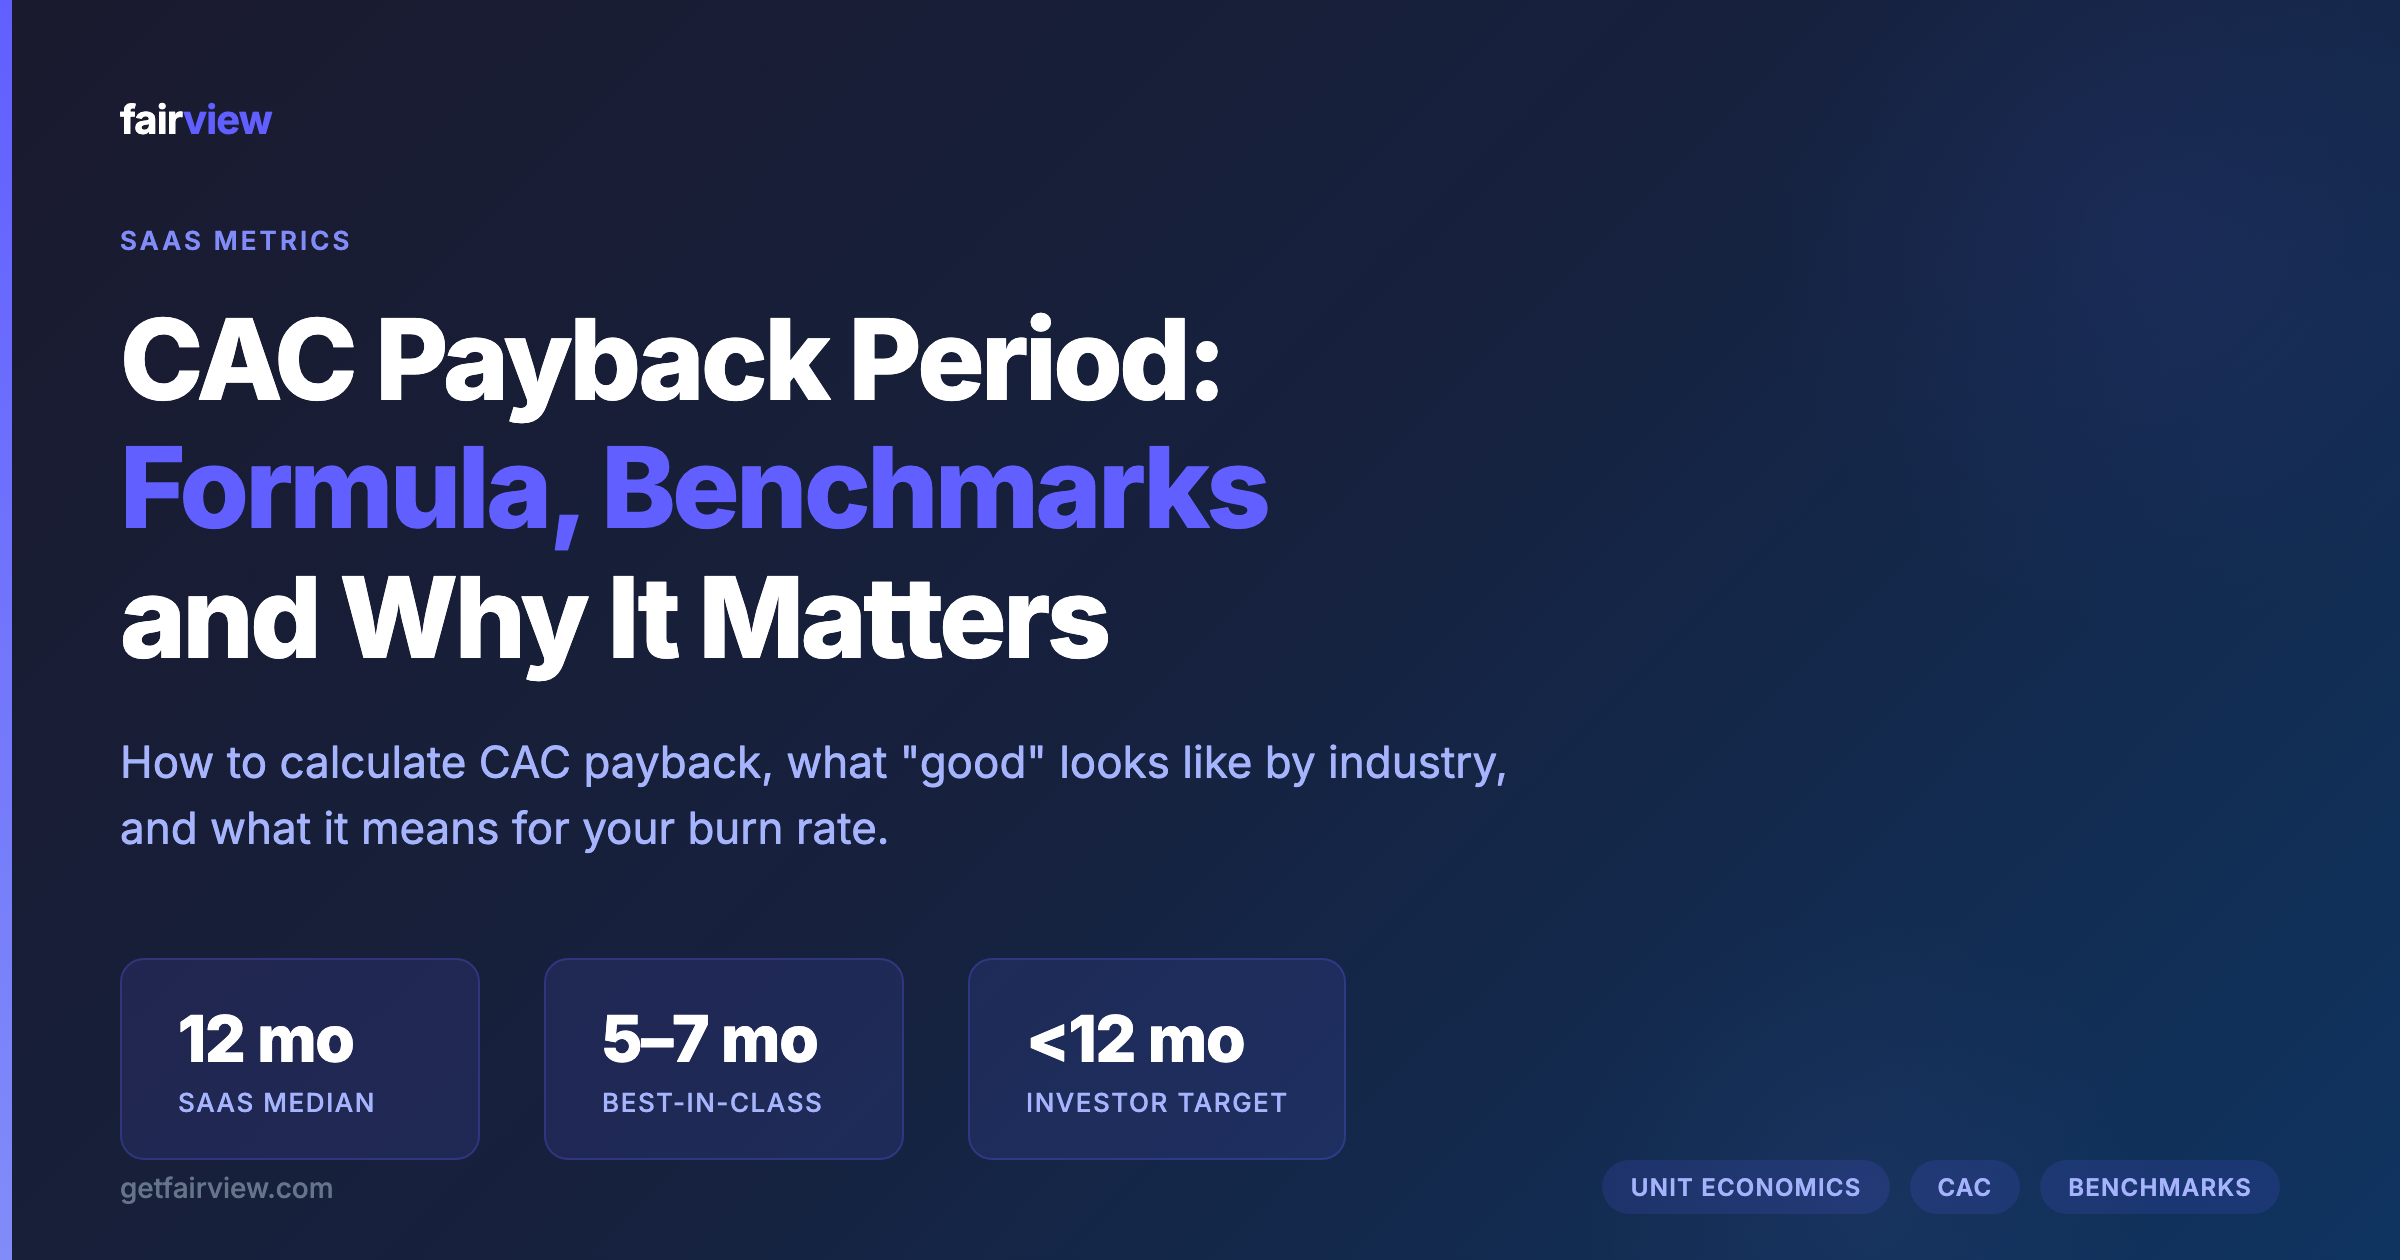
- The benchmark: For B2B SaaS, 12 months is the median. Under 12 months is healthy. Under 6 months is best-in-class. Over 18 months is a warning signal unless retention is exceptional.
- By motion: Product-led growth typically pays back in 3–6 months. Inside sales takes 8–14 months. Enterprise field sales often runs 12–24 months. The same company can have different payback periods by segment.
- Not the same as LTV:CAC: Payback measures speed. LTV:CAC measures total return. A company with a 24-month payback and a 5:1 LTV:CAC can still be a strong business if cash and retention support it.
- The burn rate connection: Every month your payback period exceeds your cash runway is a month you are financing growth with capital that may not be available. CAC payback is a primary input to burn multiple and fundraising timing.
A $5,000 CAC and a $500 monthly gross margin per customer means you wait 10 months to break even on each sale. That 10-month gap is what CAC payback period measures — and it is one of the first numbers an investor checks when they open your data room. It is also one of the most misunderstood metrics in SaaS, because the headline figure hides more than it reveals.
This guide covers the exact formula, the fully loaded cost breakdown most teams miss, benchmarks by industry and go-to-market motion, the relationship between payback and LTV:CAC, when a long payback is acceptable, and five concrete ways to shorten yours. Whether you are preparing for a fundraise or running a weekly operating review, this is the reference you need.
Definition
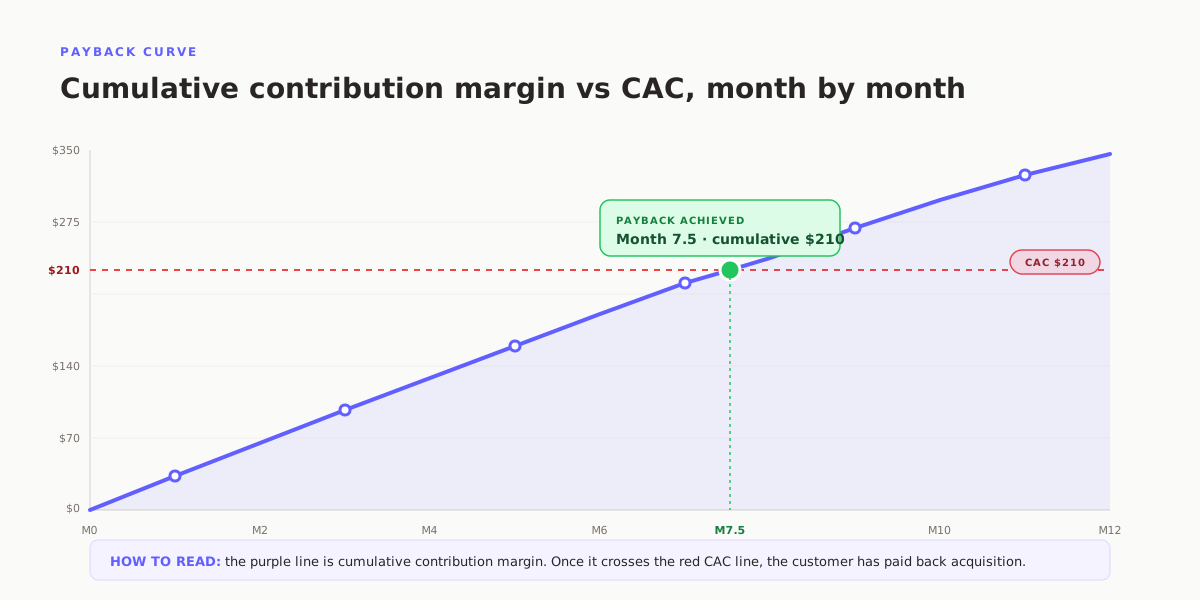
CAC payback period is the number of months required for a company to recover the full cost of acquiring a customer through the gross margin that customer generates. It measures how fast your sales and marketing investment turns into recoverable profit.
What is CAC payback period?
CAC payback period answers a simple question with significant consequences: if you spend $1 today to acquire a customer, when do you get that $1 back?
The metric matters because it connects three operational realities that most teams track separately. First, how much you spend to win a customer. Second, how much profit that customer produces each month. Third, how long your capital can support the gap between those two numbers. When payback stretches beyond your cash runway, you are financing growth with money you do not have — which is the definition of an unsustainable burn rate.
Unlike LTV:CAC, which measures total lifetime return, payback period measures speed. A company with a 3:1 LTV:CAC ratio can still fail if its payback period is 36 months and its cash runs out in 18. The two metrics are complementary, not interchangeable. Investors check both. Operators should too.
The metric is most useful when tracked by cohort and by segment. Your blended payback across all customers may look acceptable while one channel drags the average up and masks a problem in another. A $50K enterprise deal with a 24-month payback and a $2K self-serve deal with a 3-month payback produce very different capital dynamics. Treating them as one number is a common mistake that hides actionable insight.
The formula
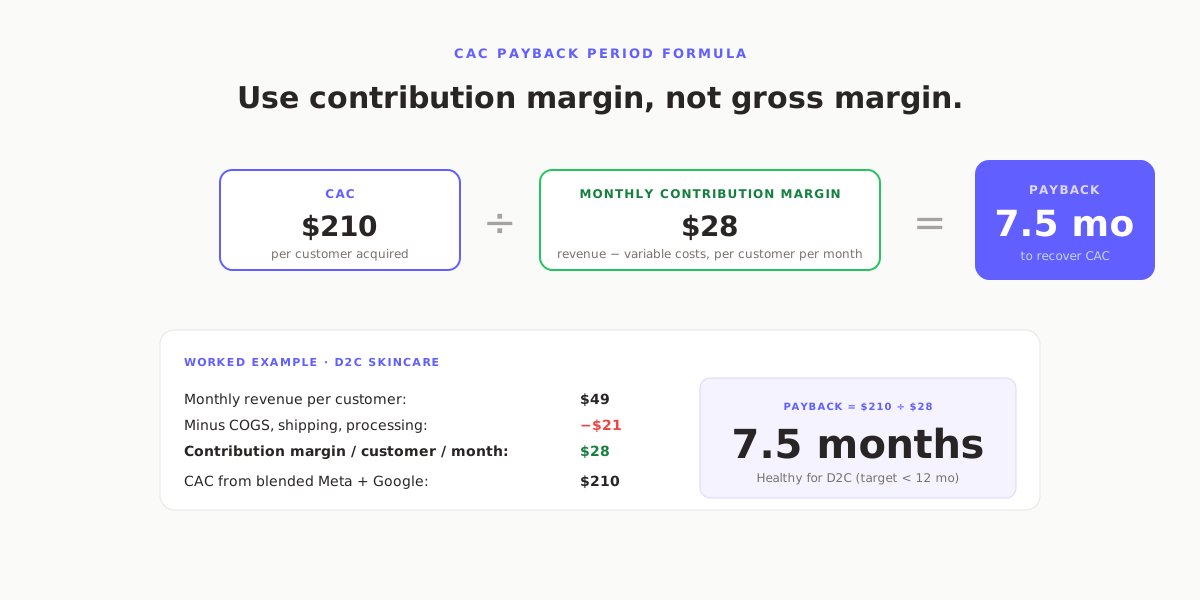
The standard formula for CAC payback period is straightforward:
CAC Payback Period (months) =
Sales and Marketing Expense in Period
÷
(New ARR Acquired in Period × Gross Margin %)
Breaking this down: the numerator is your fully loaded sales and marketing spend for the period — typically a quarter or a month. The denominator is the gross margin dollars generated by new customers acquired in that same period. Gross margin is essential here. Using revenue instead of gross margin overstates your recovery speed by ignoring the cost of delivering the product.
Worked example:
Suppose your company spent $180,000 on sales and marketing in Q2. In that same quarter, you acquired $300,000 in new annual recurring revenue from new customers. Your gross margin is 75%.
Step 1: Convert new ARR to monthly recurring revenue. $300,000 ARR ÷ 12 = $25,000 MRR.
Step 2: Apply gross margin. $25,000 MRR × 75% = $18,750 monthly gross margin from new customers.
Step 3: Calculate payback. $180,000 ÷ $18,750 = 9.6 months.
Your CAC payback period is approximately 10 months. Every new customer acquired in Q2 will take 10 months to generate enough gross margin to recover the acquisition cost.
The cohort method for precision:
The formula above produces a blended average. For a more precise view, track each month's new customers as a separate cohort. Measure how many months it takes for the cumulative gross margin from that specific cohort to exceed the acquisition cost spent to win them. This reveals whether payback is improving or deteriorating over time — a blended average can hide a worsening trend in recent cohorts.
For example, your January cohort might have a 9-month payback while your June cohort shows 14 months. The blended figure of 11.5 months looks stable. The cohort view reveals a problem that demands attention.
What counts as CAC?
The most common error in calculating CAC payback is an incomplete cost definition. Teams often include only ad spend and call it done. That produces an artificially short payback that misleads operators and disappoints investors who run their own numbers.
Fully loaded CAC includes every cost associated with acquiring new customers:
- Sales team compensation: Base salaries, commissions, bonuses, and benefits for all sales staff involved in new customer acquisition. Include SDRs, AEs, and sales leadership. Do not include account managers focused purely on expansion of existing accounts.
- Marketing team compensation: Salaries and benefits for demand generation, content, events, product marketing, and marketing operations staff.
- Advertising spend: All paid acquisition channels — search, social, display, programmatic, retargeting, sponsorships, and paid content distribution.
- Software and tooling: Sales engagement platforms, marketing automation, CRM licenses used by the go-to-market team, intent data subscriptions, and sales enablement tools.
- Events and conferences: Booth costs, sponsorships, travel, and associated materials for trade shows and field events aimed at new customer acquisition.
- Content and creative: Agency fees, freelance writers, designers, video production, and podcast production costs tied to acquisition content.
- Allocated overhead: A portion of office, IT, and administrative costs attributable to the sales and marketing functions.
What does not count:
- Customer success costs focused on retention and expansion of existing accounts
- Product development and engineering salaries
- General and administrative overhead not tied to acquisition
- Costs associated with reactivating churned customers (this is win-back, not acquisition)
The fully loaded definition matters because it is the one investors use. When you report a 6-month payback based on ad spend only and an investor recalculates with fully loaded costs, the real number may be 14 months. That gap erodes trust and can derail a fundraise.
Benchmarks by industry
Benchmarks for CAC payback period vary significantly by business model, pricing, and margin structure. The table below shows realistic ranges based on 2026 market data for companies with standard gross margins in each category.
| Industry / Model | Typical Payback | Best-in-Class | Warning Signal |
|---|---|---|---|
| B2B SaaS — SMB | 8–14 months | Under 6 months | Over 18 months |
| B2B SaaS — Mid-Market | 10–16 months | Under 8 months | Over 20 months |
| B2B SaaS — Enterprise | 12–24 months | Under 12 months | Over 30 months |
| D2C Ecommerce | 6–12 months | Under 4 months | Over 18 months |
| Consumer Subscription | 3–8 months | Under 3 months | Over 12 months |
| Marketplace (two-sided) | 12–24 months | Under 12 months | Over 30 months |
| Fintech / B2C | 6–18 months | Under 6 months | Over 24 months |
| Vertical SaaS | 8–16 months | Under 6 months | Over 20 months |
These ranges assume healthy gross margins — typically 70% or higher for SaaS, 40–60% for D2C. A company with lower gross margins will have proportionally longer payback periods even with identical CAC and pricing. This is why gross margin is in the denominator: it is not a fixed assumption.
The enterprise SaaS range is wider because contract structures vary dramatically. A company with annual upfront payment collects cash at month 0 while the payback calculation still shows 18 months of margin recovery. The cash dynamics are better than the metric suggests. A company with monthly billing and a 24-month payback faces a genuine capital gap.
Benchmarks by go-to-market motion
Your go-to-market motion is often a better predictor of payback than your industry. The same product sold through self-serve, inside sales, and field sales will produce three different payback periods.
Product-led growth (PLG): 3–6 months
PLG companies acquire users through free trials, freemium tiers, or self-serve onboarding. CAC is lower because there is no sales rep involved in the initial conversion. The trade-off is lower average contract value and higher support costs. Companies like Slack, Notion, and Figma built their early growth on sub-6-month payback through PLG mechanics. The key requirement: a product that delivers value without human intervention during onboarding.
Inside sales (high-velocity): 8–14 months
Inside sales teams close deals over the phone or video without field travel. CAC includes SDR and AE compensation but avoids the travel and entertainment costs of field sales. This is the most common motion for B2B SaaS companies between $1M and $20M ARR. Payback periods in this range are acceptable to most investors if retention is strong and the sales process is repeatable.
Field sales (enterprise): 12–24 months
Field sales involves in-person meetings, multi-stakeholder deal cycles, and higher compensation for experienced reps. CAC is high, but so is average contract value. The payback period stretches because the sales cycle itself may be 6–12 months before revenue is recognized. Enterprise SaaS companies with net revenue retention above 120% can sustain 18–24 month payback periods because expansion revenue compounds the return over time.
Channel and partner-led: 6–12 months
Partner-led acquisition splits CAC between your team and a channel partner. The economics depend heavily on partner margins and deal flow quality. Well-executed partner programs can produce payback periods comparable to PLG with the contract values of inside sales. Poorly executed programs produce high CAC with low control over the sales process.
Hybrid motions: Segment separately
Most companies at scale run multiple motions simultaneously. A mid-market SaaS company might have a self-serve tier, an inside sales team for mid-market accounts, and a field team for enterprise. Blending these into one payback number is misleading. Track each motion separately. The self-serve motion may fund the enterprise motion's longer payback through faster cash recovery.
CAC payback vs LTV:CAC
These two metrics are the most common pair in SaaS unit economics analysis. They answer different questions and should never be used as substitutes.
| Dimension | CAC Payback Period | LTV:CAC Ratio |
|---|---|---|
| What it measures | Speed of capital recovery | Total return on acquisition spend |
| Time horizon | Months to break even | Full customer lifetime |
| Key inputs | CAC, gross margin, MRR/ARR | CAC, gross margin, churn rate, expansion |
| Healthy benchmark | Under 12 months (SaaS) | 3:1 or higher |
| Risk it flags | Cash runway, burn rate | Long-term business model viability |
| When it fails | Ignores retention quality | Ignores timing of cash recovery |
A company can have an excellent LTV:CAC and a dangerous payback period. Consider a SaaS business with $50K CAC, $2K monthly gross margin, 95% annual retention, and 20% annual expansion. The LTV:CAC ratio is strong — likely 4:1 or higher. But the payback period is 25 months. If the company has 18 months of runway, the LTV:CAC ratio is irrelevant. The business runs out of cash before the payback completes.
Conversely, a company with a 6-month payback and a 2:1 LTV:CAC is recovering capital fast but not generating enough total return. This is common in low-price, high-churn environments. The business is liquid but not profitable at scale.
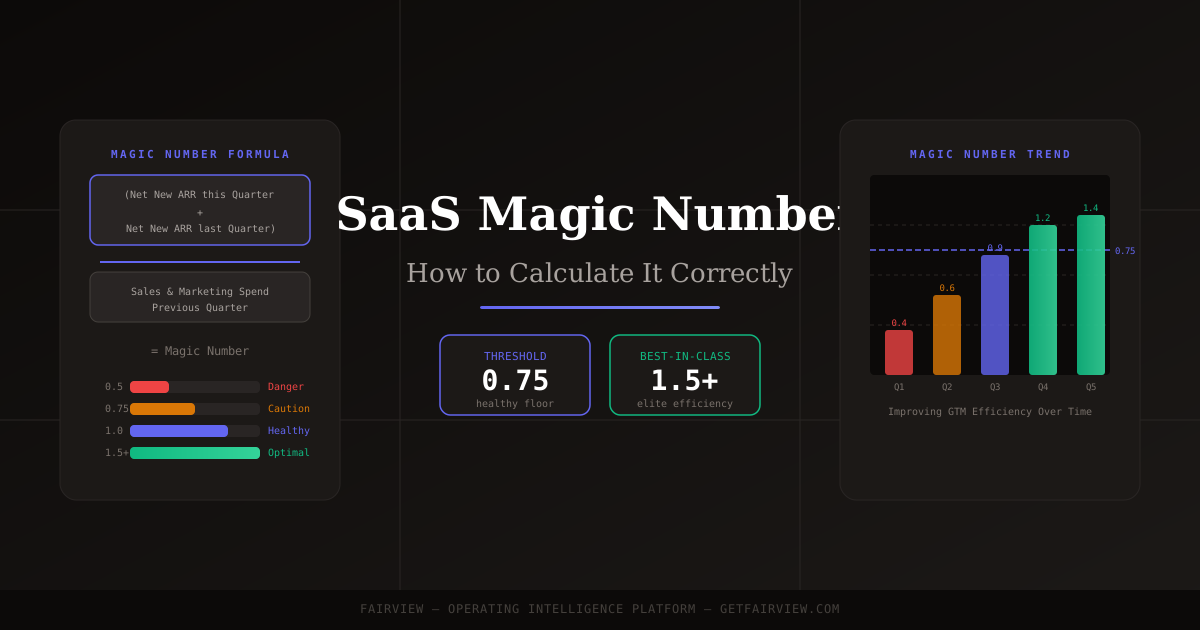
The correct approach is to evaluate both metrics together. Payback period tells you whether you can afford to grow. LTV:CAC tells you whether that growth is worth the cost. A healthy SaaS business targets under 12 months for payback and 3:1 or higher for LTV:CAC. The magic number — net new ARR divided by sales and marketing spend — is a related metric that captures quarterly sales efficiency in a single figure.
When a long payback is OK
Not every company with a payback period above 12 months is broken. There are legitimate scenarios where a longer payback is acceptable — even desirable — provided the supporting conditions hold.
1. Annual contracts with upfront payment
If your customers pay annually in advance, you collect 12 months of cash at the point of sale. The payback calculation still shows the months required for margin recovery, but your cash position is stronger than the metric suggests. A 15-month payback with annual upfront billing means you have positive cash flow from the contract before the metric says you have broken even. This is a common pattern in enterprise SaaS.
2. Net revenue retention above 110%
When existing customers expand their spend over time — through upsells, cross-sells, or usage growth — the total value of a customer exceeds the initial contract. A customer who starts at $10K ARR and grows to $25K ARR over three years generates far more margin than the payback calculation assumes. Net revenue retention above 110% means your customer base is growing even without new sales. This justifies a longer initial payback because the lifetime return is higher.
3. Proven expansion revenue model
Some business models are explicitly designed around land-and-expand: a small initial contract that grows significantly over time. Snowflake, Datadog, and Twilio all operate on this model. The initial payback may be 18 months, but the expansion revenue in years two and three produces exceptional returns. The key word is proven. A theoretical expansion model does not justify a long payback. A track record of consistent expansion does.
4. Access to capital at reasonable cost
A long payback is only a problem if you run out of money before the recovery completes. Companies with access to venture capital, debt financing, or strong operating cash flow from other segments can sustain longer payback periods while they scale. The risk increases when capital markets tighten or when a company's burn rate exceeds its ability to raise. In 2022–2023, many SaaS companies with 18–24 month payback periods faced sudden pressure to shorten them as fundraising became harder.
5. High switching costs and low churn
If your product embeds deeply into a customer's operations — through integrations, data accumulation, or workflow dependency — churn will be low and customer lifetime will be long. A 24-month payback is acceptable if your average customer stays for 8 years. The same payback is dangerous if half your customers churn within 18 months. Switching costs extend lifetime, which increases LTV, which justifies the longer initial recovery period.
5 ways to shorten CAC payback
Improving CAC payback is not about cutting growth. It is about making the same growth cost less or produce more margin. Here are five levers operators use, ordered by typical impact.
1. Improve gross margin
Since gross margin is in the denominator, every percentage point of improvement directly shortens payback. A company with 70% gross margin and a 14-month payback drops to 10.5 months by improving gross margin to 85% — assuming CAC and pricing stay constant. Gross margin improvements come from reducing cost of goods sold, automating customer onboarding, raising prices, or shifting to higher-margin product tiers. Pricing is the fastest lever. Most SaaS companies underprice relative to the value they deliver.
2. Shift to annual billing
Annual contracts with upfront payment improve cash flow even if they do not change the payback calculation. More importantly, annual commitments reduce churn because customers have skin in the game for a full year. Lower churn extends lifetime value, which indirectly improves the economics that justify acquisition spend. Companies that shift from monthly to annual billing often see payback periods improve by 20–30% because the customer base becomes more stable and the sales team spends less time on retention.
3. Reduce CAC through channel optimization
Not all acquisition channels produce the same payback. A channel with $3K CAC and a 6-month payback funds a channel with $15K CAC and an 18-month payback. The mistake most teams make is averaging them rather than optimizing each separately. Audit your channels by payback period, not just by volume. Cut or reduce spend on channels with payback periods above your threshold. Double down on channels that recover fast. This sounds obvious, but most marketing teams optimize for lead volume or total pipeline, not for payback speed.
4. Increase average contract value
Higher ACV means more gross margin per customer, which shortens payback proportionally. A $1K monthly contract with 80% gross margin produces $800 monthly gross margin. A $2K contract at the same margin produces $1,600. The payback period halves. ACV improvements come from better packaging (tiering features to encourage upgrades), targeting larger accounts, adding services or implementation fees, and improving sales team negotiation. The constraint is product-market fit: raising prices on a product that does not deliver sufficient value increases churn, which destroys the benefit.
5. Improve sales velocity
A shorter sales cycle reduces the cost of acquisition because sales reps close more deals per quarter. If an AE closes 4 deals per month with a 3-month cycle, shortening the cycle to 6 weeks raises capacity to 8 deals per month — halving the CAC per deal if compensation is fixed. Sales velocity improvements come from clearer qualification criteria, better demo practices, streamlined procurement, and removing decision-makers from the approval chain where possible. The Fairview Pipeline Health Monitor flags deals that are stalling so managers can intervene before the cycle extends.
How Fairview tracks CAC payback
Calculating CAC payback once is easy. Tracking it accurately every week — by cohort, by channel, by segment — is where most teams struggle. The data lives in four or five different systems, and reconciling it manually takes hours that operators do not have.
Fairview connects to your CRM, finance tools, and ad platforms through the Data Connection Layer. It pulls revenue data from Stripe or your payment processor, cost data from QuickBooks or Xero, and acquisition data from your CRM and ad platforms. The system normalizes the data — so "new customer" means the same thing regardless of which source it came from — and calculates CAC payback automatically.
The Operating Dashboard surfaces payback period alongside related metrics: CAC by channel, gross margin by product line, and new ARR by cohort. When payback drifts outside your target range, Fairview flags the anomaly and recommends a specific action — which channel to review, which segment is dragging the average, or where gross margin has dropped.
The Weekly Operating Report includes payback period in its standard summary, delivered every Monday morning. Operators arrive at their review already briefed on whether acquisition economics are improving or deteriorating — and what to do about it.
Fairview does not replace your finance team's detailed analysis. It replaces the manual assembly work that prevents most operators from tracking payback as often as they should. If you are preparing for a fundraise, running a board deck, or simply managing burn rate week to week, having the number updated and accurate without the spreadsheet work changes what you can pay attention to.
To see how Fairview tracks CAC payback alongside margin, pipeline, and forecast data, book a demo and walk through the operating view with your own data connected.
Key takeaways
- CAC payback period measures how many months it takes to recover acquisition cost through gross margin. The formula is Sales and Marketing Spend divided by (New ARR times Gross Margin %).
- Fully loaded CAC includes all sales and marketing costs — salaries, commissions, ad spend, software, events, and allocated overhead. Partial definitions mislead operators and erode investor trust.
- For B2B SaaS, 12 months is the median benchmark. Under 12 months is healthy. Under 6 months is best-in-class. Over 18 months is a warning signal unless retention, expansion, or billing structure supports it.
- Payback period and LTV:CAC measure different things. Payback measures speed of recovery. LTV:CAC measures total return. Evaluate both together — a strong LTV:CAC does not fix a dangerous payback period.
- The five levers to shorten payback are: improve gross margin, shift to annual billing, optimize channels by payback speed, increase average contract value, and improve sales velocity.
If you are tracking CAC payback in spreadsheets that take hours to update, Fairview connects your CRM, finance, and marketing data into one operating view — and surfaces the next action when payback drifts. Book a demo to see how it works for your business.
How do you calculate CAC payback period?
The standard formula is: CAC Payback Period = Sales and Marketing Expense in Period / (New ARR Acquired in Period x Gross Margin %). The result is expressed in months. For a more precise view, use the cohort method: track each month's new customers individually and measure how many months their cumulative gross margin takes to exceed the acquisition cost spent to win them.
What is a good CAC payback period for SaaS?
For B2B SaaS, 12 months is the widely cited median benchmark. Under 12 months is considered healthy for most companies. Under 6 months is best-in-class and signals strong product-market fit with efficient acquisition. Over 18 months is a warning signal unless you have very high retention, strong expansion revenue, or a clear path to shortening the payback through pricing or channel improvements.
What counts as CAC?
Fully loaded CAC includes all sales and marketing expenses: salaries and commissions for sales and marketing teams, advertising spend across all channels, software and tooling costs for the go-to-market stack, event and conference costs, content production and agency fees, and allocated overhead for the departments involved in acquisition. It does not include customer success costs focused on retention, product development, or general administrative overhead.
Is CAC payback period the same as LTV:CAC?
No. CAC payback period measures speed — how fast you recover the cost of acquiring a customer. LTV:CAC measures total return — how much value a customer generates over their entire relationship relative to acquisition cost. A company can have a 24-month payback period and a 5:1 LTV:CAC if retention is exceptional. The two metrics answer different questions and should be evaluated together, not as substitutes.
When is a long CAC payback period acceptable?
A long payback period is acceptable when three conditions hold: annual contracts with upfront payment that provide cash before the payback is complete, net revenue retention above 110% that compounds customer value over time, a proven expansion revenue model where customers grow their spend significantly, and access to capital that can fund the gap without threatening runway. Enterprise SaaS with multi-year contracts and strong land-and-expand mechanics often operate with 18–24 month payback periods and still attract capital.
How can I shorten my CAC payback period?
Five levers: improve gross margin by reducing cost of delivery or raising prices; shift to annual billing to collect cash upfront; reduce CAC by cutting underperforming channels and doubling down on efficient ones; increase average contract value through packaging, upsells, or targeting larger accounts; and improve sales velocity by removing friction from the deal cycle. The fastest wins usually come from pricing and channel optimization, not from cutting total spend.