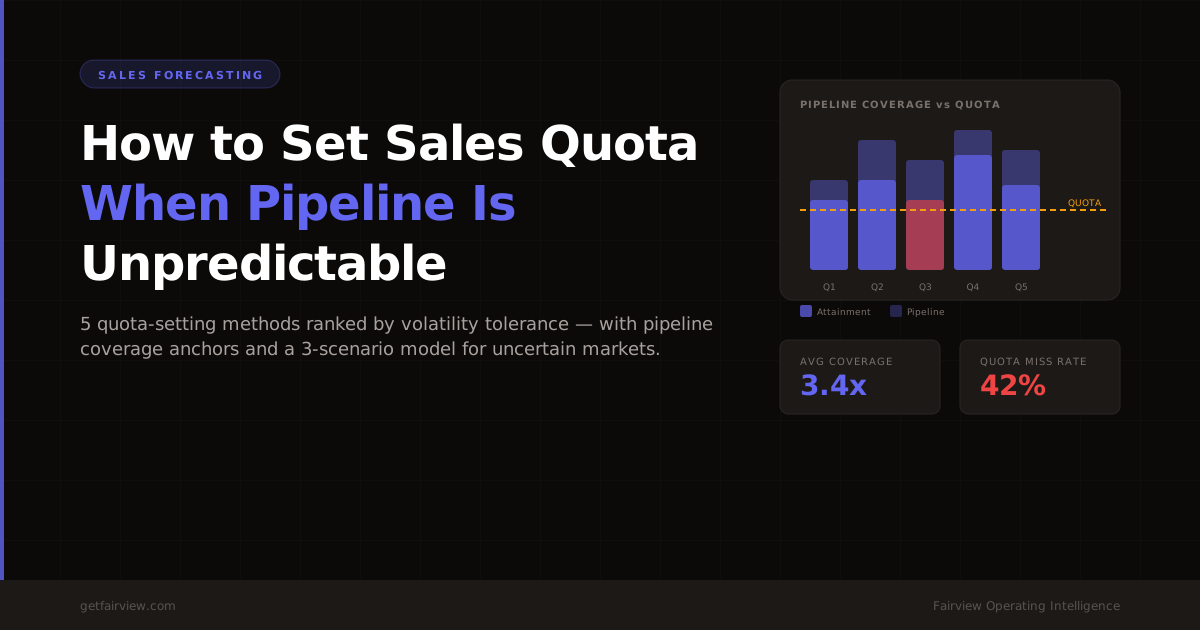
- Standard run-rate quotas assume stable, predictable pipeline. When pipeline is volatile, they produce quotas that are either consistently unachievable or never stretched enough.
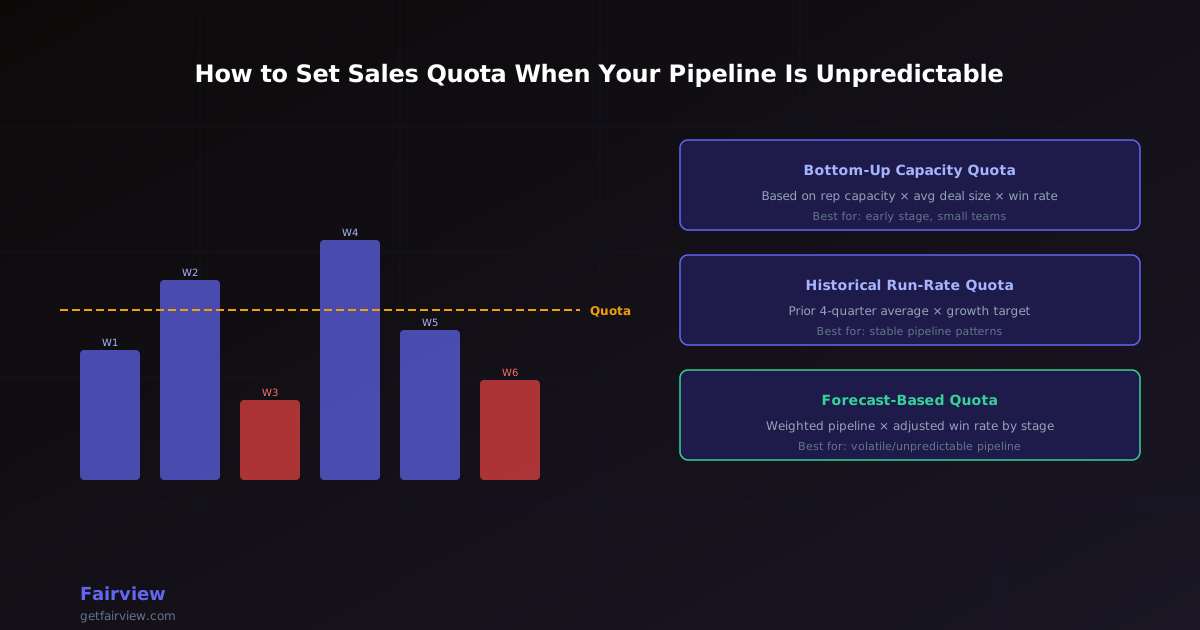
- The three frameworks that work for unpredictable pipelines: Bottom-Up Capacity Quota, Weighted Pipeline Quota, and Activity-Based Quota.
- A healthy quota attainment rate is 60–70% of reps hitting quota. Below 40% means the quota is detached from reality; above 80% means you have set the bar too low.
- Quota must be set before the period, with full visibility into current pipeline state and win rate by stage.
- When pipeline is genuinely unpredictable, use a range quota (floor, target, stretch) rather than a single number.
Quota-setting is one of the most consequential decisions a sales leader makes each quarter. Set it too high and you get mass quota miss, demoralized reps, and attrition. Set it too low and you leave revenue on the table and signal to the board that you do not understand your own business. Set it without a clear methodology and you get both problems alternating each quarter, which is what most teams actually experience.
The classic approach — take last quarter's number, add 20%, divide by rep count — works when your pipeline is predictable and your win rate is stable. Those conditions apply to a narrow range of mature, optimized sales organizations. For most growing companies, pipeline is lumpy, win rates vary by deal type and source, and the prior quarter's performance may have been heavily influenced by factors that will not repeat.
This guide covers three quota-setting frameworks that work when your pipeline is not predictable, with worked examples for each, and the pipeline monitoring discipline required to make any quota-setting approach accurate over time. For the broader context of how quota fits into your revenue architecture, see the guide on pipeline coverage ratio.
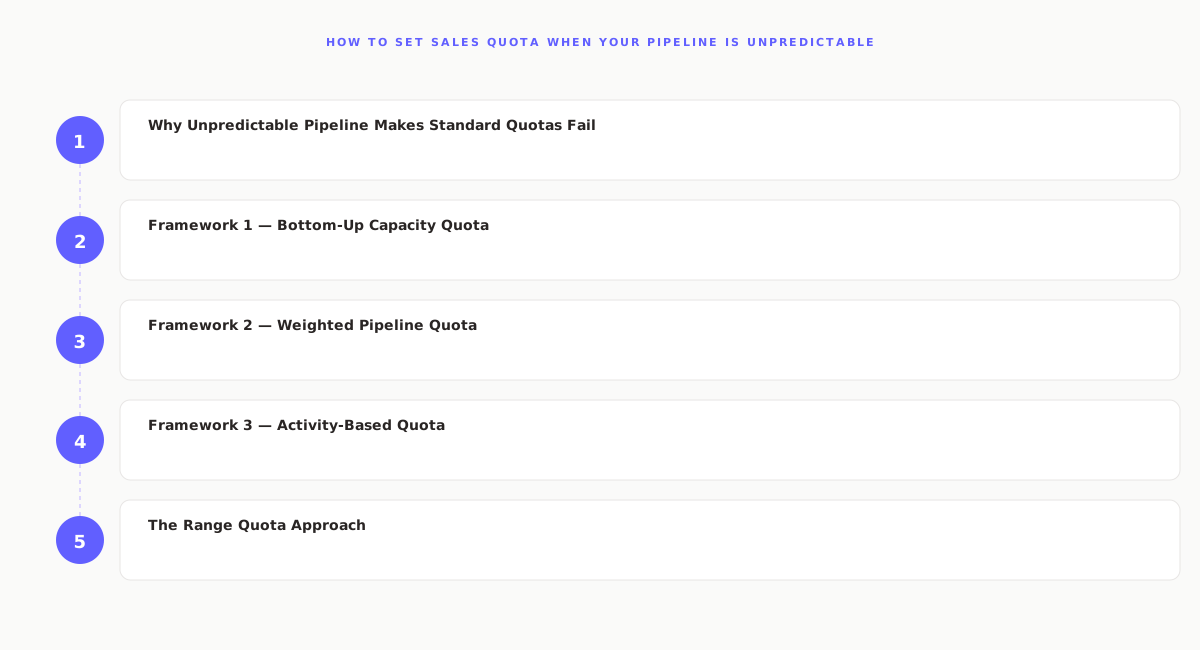
Why Unpredictable Pipeline Makes Standard Quotas Fail
Before picking a quota methodology, it is worth diagnosing precisely what is making your pipeline unpredictable. There are four distinct causes, and each has a different implication for how you should set quota.
Cause 1: Seasonality
Deal flow varies predictably by quarter or month, but the variance is large enough that a uniform annual quota divided by four overstates the target in slow quarters and understates it in strong ones. The fix is seasonal quota adjustment: model the historical quarterly distribution of revenue and apply it to your annual target. A company that does 40% of annual revenue in Q4 should have a Q4 quota that reflects that pattern.
Cause 2: Lumpy Deal Size Distribution
Your deal size distribution has high variance — most deals close between $10K and $30K, but a handful close above $200K in any given quarter. The large deals are real but unrepeatable at a predictable rate. Standard average-deal-size models overestimate in quarters without large deals and underestimate in quarters that happen to contain several. The fix is to separate quota into two tiers: a core quota based on your repeatable mid-market deal motion, and a separate incentive structure for enterprise-scale deals.
Cause 3: New Rep Ramp
Your team is growing and a significant portion of your quota-carrying headcount is ramping. New reps typically operate at 40–60% of full productivity in month one, 60–80% in month two, and approach full productivity in month three and beyond. Applying full quota to ramping reps produces systematic miss that has nothing to do with pipeline quality or rep performance.
Cause 4: Market Volatility
External market conditions — economic uncertainty, competitive disruption, regulatory changes — are creating genuine deal volatility that is not predictable from historical data. This is the hardest case, and it requires the most conservative approach: use activity-based quotas as the primary accountability mechanism while revenue targets are treated as ranges rather than point estimates.
Framework 1 — Bottom-Up Capacity Quota
The bottom-up capacity quota builds the quota from what each rep can realistically achieve given their capacity, deal size, and win rate — rather than from what the business needs to hit its revenue target.
= 8 × 52 × $24,000 × 0.28 ÷ 2 = ~$1.39M annual quota per rep
The capacity model forces you to be explicit about every assumption: how many qualified conversations can a rep run per week (activity), what percentage of conversations progress to a qualified opportunity (conversion), what the average deal size is (excluding outliers), and what the win rate is from qualified opportunity to close. Each of these has a historical basis and a current state — use both to sense-check the model.
This method is most appropriate for: early-stage teams with limited historical data, teams expanding into new segments where historical data does not transfer, and post-restructuring situations where the team composition has changed materially.
Framework 2 — Weighted Pipeline Quota
The weighted pipeline quota uses current pipeline data and historical win rates by stage to estimate what revenue is achievable in the period, then sets quota as a percentage of that achievable figure.
Total weighted pipeline = $775K → Quota set at 85–90% of weighted pipeline = ~$660K–$700K
This method accounts for the actual current state of the pipeline and the historical conversion rates that determine what fraction of that pipeline will actually close. When pipeline is volatile, the weighted pipeline estimate changes week to week — which is exactly why you need reliable, current pipeline data before setting or adjusting quota.
The weakness of this method is that it requires accurate stage win rates. Teams without rigorous CRM hygiene — where stage definitions are subjective and reps move deals forward optimistically — will have inflated win rate estimates at early stages. The Fairview Pipeline Health Monitor surfaces stage-by-stage conversion rates and flags anomalies, giving you the clean win-rate data that makes weighted pipeline quotas reliable.
Framework 3 — Activity-Based Quota
When revenue outcomes are genuinely unpredictable — new market, early stage, high external volatility — hold reps accountable for the activities that are within their control rather than the revenue outcomes that are partly determined by external factors outside their control.
| Activity Metric | Weekly Target | How to Set |
|---|---|---|
| Qualified discovery calls | 8–12 per rep | Based on conversion rate from activity to pipeline |
| New opportunities created | 4–6 per rep | Based on historical SQL-to-opportunity conversion |
| Proposals sent | 2–3 per rep | Based on historical opportunity-to-proposal conversion |
| Pipeline generation (value) | $X per quarter | Required to support next quarter's revenue target at current coverage ratio |
Activity-based quotas do not replace revenue targets — they complement them when revenue outcomes are too noisy for revenue quotas alone to drive the right behaviors. Reps who consistently hit their activity metrics and maintain healthy pipeline are doing the right work; reps who miss revenue targets despite hitting activity metrics indicate a conversion or deal-quality problem rather than a rep motivation problem.
The Range Quota Approach
For genuinely volatile pipelines, a single quota number is often the wrong format. A range quota — floor, target, and stretch — acknowledges the uncertainty in your forecast while preserving accountability across the full range of outcomes.
| Level | Definition | Compensation Implication |
|---|---|---|
| Floor | Minimum acceptable performance; below this triggers a performance conversation | No accelerator; commission at standard rate |
| Target | Expected performance based on weighted pipeline and capacity model | Full OTE achieved at this level |
| Stretch | Ambitious but achievable with exceptional execution and favorable close rates | Accelerated commission above this level (1.5–2× standard rate) |
The range format also helps with the communication challenge of unpredictable pipeline. When reps understand that floor, target, and stretch represent a realistic distribution of outcomes given current pipeline state — not a political negotiation with management — they are more likely to commit to the target rather than sand-bag toward the floor.
Building the Pipeline Data Infrastructure for Quota Setting
Every quota-setting framework described above depends on accurate, current pipeline data. The most common reason quota-setting fails is not methodology — it is that the data going into the model is wrong.
The data requirements for reliable quota setting:
- Stage-by-stage win rates calculated from closed-won and closed-lost history over at least four quarters, segmented by deal size tier and source channel
- Current pipeline value by stage with hygiene applied — stale deals removed, zombie deals flagged, close date accuracy validated
- Rep-level activity metrics (calls, meetings, proposals) to validate the capacity assumptions in bottom-up models
- Average sales cycle by deal size tier to determine what portion of current pipeline will close within the quota period
Maintaining this data manually — pulling from the CRM, cleaning it in spreadsheets, building models — is the primary constraint on quota accuracy for most RevOps teams. Fairview's Pipeline Health Monitor surfaces stage-level conversion rates and pipeline health indicators automatically, reducing the data preparation work for quota reviews from days to hours. See it in action →
Stop spending Monday mornings in spreadsheets.
Fairview connects your CRM, billing, and ad data — surfacing the clean pipeline metrics your quota model depends on. See how it works →
Book a Free DemoHow do you set sales quotas without historical data?
Use the bottom-up capacity method: estimate how many qualified conversations a rep can run per week, multiply by average deal size and estimated win rate, and adjust for sales cycle length. Then validate against your revenue target and adjust rep count or deal size expectations accordingly.
What is a realistic quota attainment rate?
A healthy sales team sees 60-70% of reps achieve quota. If attainment is consistently above 80%, quotas are likely set too low. Below 40% indicates quotas are set too high relative to current capacity and pipeline reality — which drives attrition and forecast inaccuracy.
How often should sales quotas be adjusted?
Quarterly review is the standard. Major market shifts, significant product changes, or new competitive dynamics may warrant mid-quarter adjustments — but frequent quota changes erode trust. The goal is to set quotas at the start of each quarter that remain valid throughout it.