Founder, Fairview
TL;DR
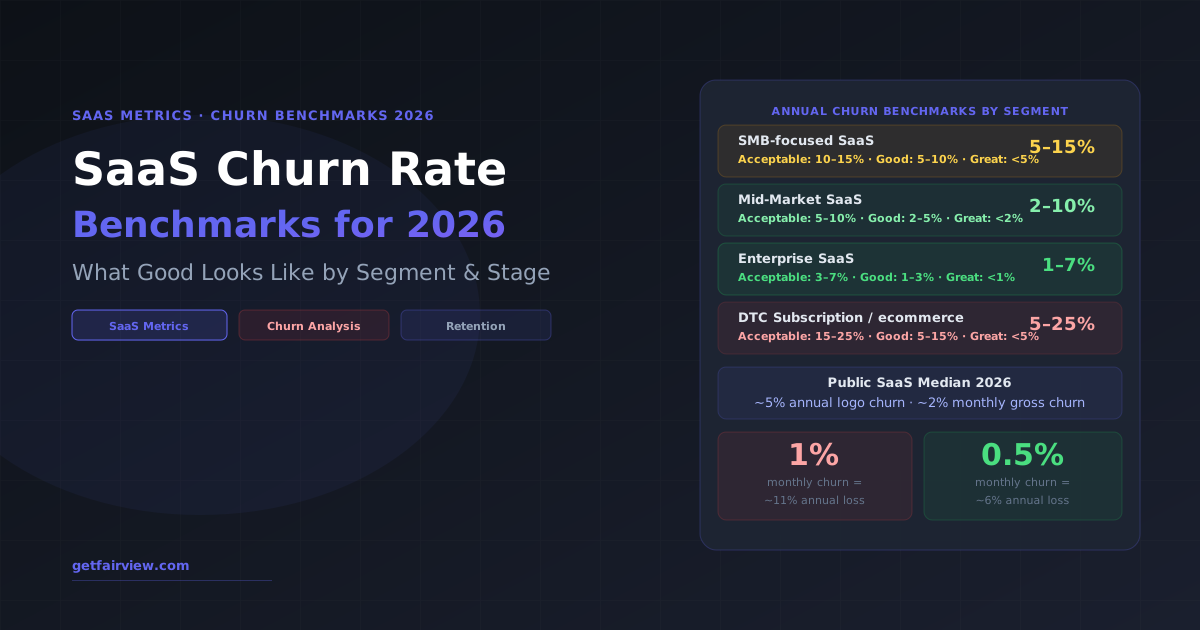
2026 SaaS churn benchmarks: SMB (<10% annual is good, <5% excellent), Mid-market (<5% good, <2% excellent), Enterprise (<3% good, <1% excellent). The public SaaS median is ~5% annual logo churn. Monthly churn of 1% compounds to ~11% annual loss — more harmful than most founders realize. The highest-leverage fixes are ICP tightening, onboarding improvement, and health score monitoring with early CS intervention.
Churn is the metric that every SaaS investor asks about second — right after ARR growth. And for good reason: high churn means you are filling a leaky bucket, spending constantly to replace revenue you are losing rather than building on it.
But "high churn" and "low churn" mean very different things depending on who your customers are. An 8% annual churn rate is respectable for an SMB-focused SaaS product but alarming for an enterprise platform. This guide provides 2026 benchmarks by segment and the strategies that actually move the number.
The Churn Rate Formula
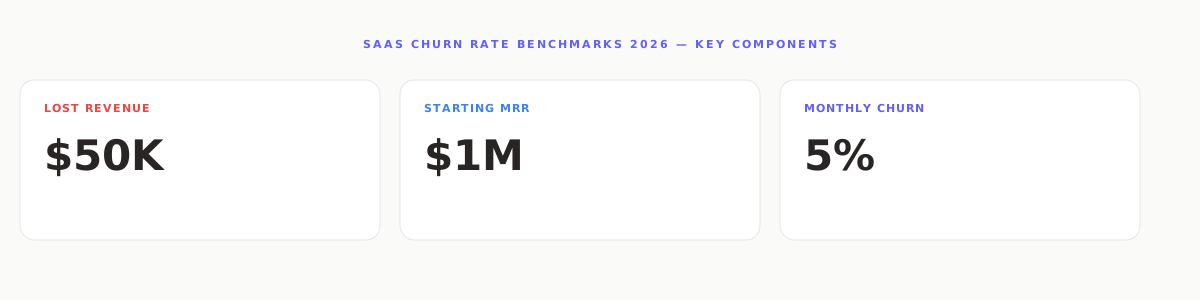
The compounding formula matters more than most founders realize. A seemingly small 1% monthly churn does not equal 12% annual churn — it equals approximately 11.4%. At 2% monthly, the annual rate is approximately 21.5%. These are materially different from naive multiplication, especially when you are calculating NDR or presenting churn to investors.
Logo Churn vs. Revenue Churn
There are two ways to measure churn, and they tell different stories:
- Logo churn: The percentage of customers lost, regardless of their ARR. Useful for understanding customer retention rate and CS coverage gaps.
- Revenue churn (gross dollar churn): The percentage of ARR lost to churned accounts. This is what drives your NDR calculation and is more relevant to investors.
A company can have low logo churn but high revenue churn if large customers are leaving. Conversely, high logo churn with low revenue churn often indicates small, high-touch SMB customers churning while large accounts stay stable.
2026 Churn Rate Benchmarks by Segment
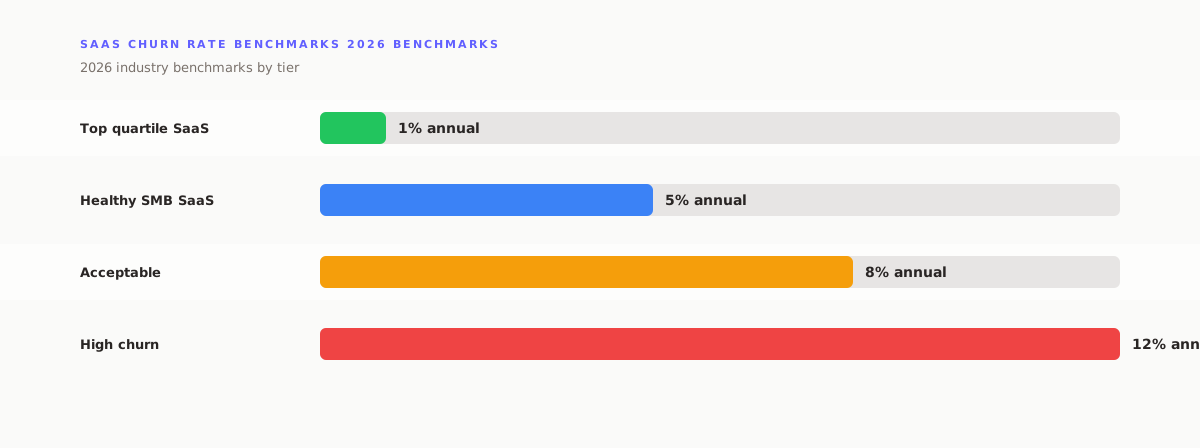
| Segment | Annual Logo Churn | Monthly Gross Churn | Verdict |
|---|---|---|---|
| SMB SaaS | |||
| Excellent | < 5% | < 0.4% | Top quartile |
| Good | 5–10% | 0.4–0.8% | Healthy |
| Acceptable | 10–15% | 0.8–1.3% | Needs work |
| Red flag | > 15% | > 1.3% | Fix urgently |
| Mid-Market SaaS | |||
| Excellent | < 2% | < 0.17% | Top quartile |
| Good | 2–5% | 0.17–0.4% | Healthy |
| Acceptable | 5–10% | 0.4–0.8% | Needs work |
| Enterprise SaaS | |||
| Excellent | < 1% | < 0.08% | World-class |
| Good | 1–3% | 0.08–0.25% | Healthy |
| Acceptable | 3–7% | 0.25–0.6% | Needs work |
| Public SaaS Median (2026) | ~5% annual | ~0.4% monthly | ~108% NDR |
Why SaaS Customers Churn: The 5 Root Causes
1. ICP misalignment: The single most common driver of preventable churn. Selling to customers who do not get enough value from your product — because they are too small, have the wrong workflow, or are solving a different problem — creates a churn factory. Tightening your ICP definition reduces churn before customers even sign.
2. Onboarding failure: Customers who do not reach a meaningful "aha moment" within their first 30-60 days are dramatically more likely to churn at their first renewal. Poor onboarding is often the largest single lever for churn reduction because it affects the entire cohort.
3. Champion loss: The person who bought and advocated for your product leaves the company. The incoming person had no involvement in the purchase decision and faces no switching cost. This is especially damaging in enterprise SaaS and is hard to prevent without multi-threading accounts during the initial sale.
4. Feature gaps: A customer needs a capability you do not have, a competitor launches it, and the switching cost is low enough to justify the move. Feature-gap churn is often a signal of roadmap misalignment — you are building for one use case while a segment of customers needs something adjacent.
5. Perceived ROI erosion: The product delivered value in year one, but the customer has stopped measuring it. At renewal, they evaluate whether to continue based on current perception rather than historical ROI. CS teams that run regular value reviews significantly reduce this type of churn.
5 Strategies That Actually Reduce Churn
How Fairview Monitors Churn Risk Signals
Fairview's operating intelligence platform continuously monitors customer engagement signals alongside NDR and expansion metrics. For SaaS companies using Fairview:
- Customer health scores calculated from CRM activity, product usage data, and support patterns
- Automated alerts when accounts show declining engagement — surfaced 60-90 days before typical churn timing
- Cohort-level churn analysis by acquisition channel, ICP segment, and onboarding path
- Renewal risk dashboard showing which accounts are at risk before CS needs to manually track them
Identify churn risk before customers cancel
Fairview's customer health scoring surfaces at-risk accounts 60-90 days before renewal — giving your CS team time to act.
Book a Demo →What is the churn rate formula?
What is the difference between logo churn and revenue churn?
What causes high churn in SaaS?
Is 1% monthly churn acceptable for SaaS?
Key Takeaways
- Benchmark against your segment — 8% annual churn is respectable for SMB SaaS but alarming for enterprise. Context determines whether your number is a problem.
- 1% monthly churn = ~11% annual. The compounding effect makes "small" monthly churn rates more damaging than most founders realize.
- Health scoring is the highest-ROI CS investment — it catches churn risk 60-90 days before renewal, when intervention is still possible.
- ICP tightening is the most sustainable churn reduction — CS teams cannot rescue fundamentally wrong-fit customers at scale.
- Champion loss is structural risk — multi-thread accounts from the initial sale, not when you notice a champion going dark.
- Churn and NDR are inverses — every percentage point of churn reduction flows directly into higher NDR and improved Rule of 40 scores.