SaaS Metrics

The Rule of 40 for SaaS: What It Means and How to Calculate It

The Rule of 40 explained for SaaS operators: formula, benchmarks by stage from seed to public, worked examples, when it misleads, growth vs profit paths, and how to improve your score.

Siddharth Gangal 18 min read
The Rule of 40 for SaaS: What It Means and How to Calculate It
On this page
  1. What Is the Rule of 40?
  2. Why 40?
  3. How to Calculate It
  4. Benchmarks by Stage
  5. When the Rule of 40 Is Misleading
  6. Growth-Heavy vs Profit-Heavy Paths
  7. How to Improve Your Rule of 40 Score
  8. Rule of 40 vs Other SaaS Benchmarks
  9. How Fairview Helps Track the Rule of 40
  10. Key Takeaways

TL;DR

  • What it is: The Rule of 40 is a simple benchmark for SaaS health. Add your year-over-year revenue growth rate (%) to your profit margin (%). If the sum is 40 or higher, you pass.
  • Why it matters: Investors use it as a quick filter. Public SaaS companies above the threshold trade at meaningfully higher revenue multiples than those below it.
  • Where it breaks: The Rule of 40 ignores capital efficiency, balance sheet risk, and revenue quality. A company can score 50 and still run out of cash in 9 months.
  • Two levers: You can hit 40 through high growth + low profit, low growth + high profit, or a balanced mix. The path you choose signals your strategy to the market.
  • Operator takeaway: Track the Rule of 40 monthly alongside your SaaS unit economics and burn multiple. No single metric tells the whole story.

The Rule of 40 is the closest thing SaaS has to a universal vital sign. Investors, board members, and operators use it to answer one question quickly: is this business healthy enough to justify its valuation? The formula is simple — growth rate plus profit margin — but the implications are not. A company at 20% growth and 20% margin passes the test. So does a company at 60% growth and negative 20% margin. Both score 40. Neither story is the same.

This guide explains what the Rule of 40 actually measures, where it came from, how to calculate it correctly, what good looks like at each stage of company growth, when the metric misleads, and how operators can move the number in the right direction. We'll also compare it to other SaaS benchmarks so you know when to use it — and when to look elsewhere.

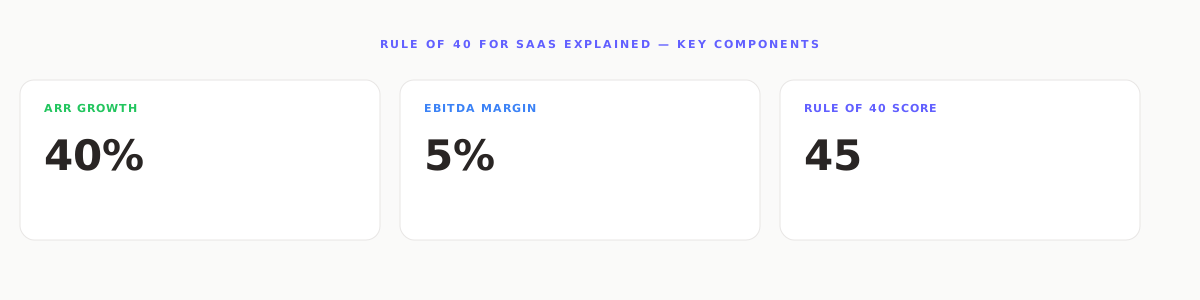
The Rule of 40 for SaaS visualized as a gauge showing growth rate plus profit margin equals the threshold score
The Rule of 40 adds revenue growth rate and profit margin into a single health score that investors use to filter SaaS companies.

What Is the Rule of 40?

Rule Of 40

The Rule of 40 states that a healthy SaaS company should have a combined revenue growth rate and profit margin of at least 40%. The formula is:

Rule of 40 Score = Revenue Growth Rate (%) + Profit Margin (%)

Both inputs are expressed as positive or negative percentages. A company growing revenue at 35% year-over-year with a 10% EBITDA margin scores 45. A company growing at 15% with a 30% margin also scores 45. The metric does not distinguish between the two paths — it treats them as equivalent.

This equivalence is both the strength and the weakness of the Rule of 40. The strength: it forces a conversation about the trade-off between growth and profitability. The weakness: it treats fundamentally different business models as interchangeable. A high-growth, cash-burning startup and a slow-growth, cash-generating mature business can both score 40. They are not the same investment.

The metric is typically calculated on a trailing-twelve-month (TTM) basis. Some operators use quarterly annualized growth rates for faster-moving businesses, but TTM is the standard for benchmarking against public companies and investor expectations. The profit margin component is usually EBITDA margin or free cash flow margin. EBITDA is more common for growth-stage SaaS because it strips out non-operational factors like depreciation and interest. Free cash flow is more conservative and reflects the actual cash available to the business.

Key distinction: The Rule of 40 is a screening tool, not a diagnostic. It tells you whether a company is in the right neighborhood. It does not tell you why it is there, whether it can stay there, or what risks it carries.

Why 40?

The Rule of 40 originated in venture capital and growth equity circles in the early 2010s. Brad Feld, a venture capitalist at Foundry Group, is widely credited with popularizing the concept, though similar thinking existed in private equity before it had a name. The number 40 was not derived from a mathematical proof. It emerged from observation: the best-performing SaaS companies, public and private, tended to cluster around this threshold.

Why 40 and not 35 or 50? The answer lies in what the number represents in practice. A SaaS company at 40% combined growth and margin is typically generating enough cash flow to fund its own operations while still expanding. Below 40, the business is either growing too slowly to justify its valuation or burning too much cash to sustain itself without continuous external funding. Above 40, the business is generating a surplus that can be reinvested, returned to shareholders, or held as a buffer.

The metric gained prominence after the 2020–2021 zero-interest-rate period, when growth-at-all-costs strategies produced companies with impressive top-line numbers and catastrophic unit economics. When capital became more expensive in 2022 and 2023, investors shifted focus from pure growth to sustainable growth. The Rule of 40 became a shorthand for sustainability — a way to ask, quickly, whether a company's growth was worth what it cost.

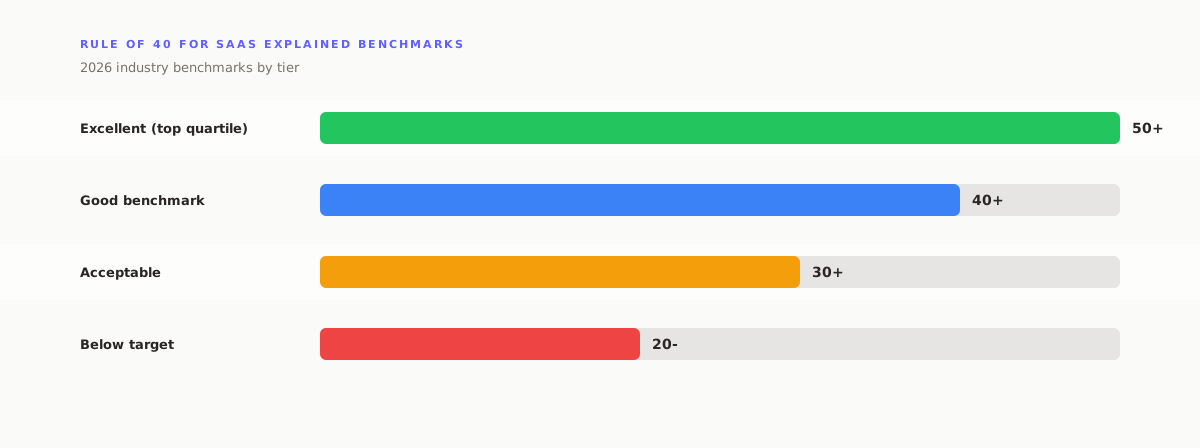
Research by SaaS Capital, which tracks B2B SaaS valuations, has consistently shown that companies above the Rule of 40 threshold command higher revenue multiples. In their 2024 analysis, public SaaS companies with a Rule of 40 score above 50 traded at median revenue multiples approximately 2.5× higher than those with scores below 30. The relationship is not linear — there is a meaningful step-up once a company crosses the 40 threshold, and another step-up above 50.

However, the Rule of 40 is not a law of physics. It is a heuristic. Heuristics are useful because they are fast. They are dangerous because they are incomplete. The rest of this guide covers what the Rule of 40 misses — and what to pair it with.

How to Calculate It

The calculation is simple in theory. In practice, three decisions determine whether your number is useful or misleading: which growth metric to use, which profit metric to use, and what time period to measure.

Step 1: Choose your growth metric

Year-over-year (YoY) revenue growth is the standard. Calculate it as:

YoY Revenue Growth = (TTM Revenue – Prior TTM Revenue) / Prior TTM Revenue × 100

Use recognized revenue, not bookings or ARR, unless you are comparing against a benchmark that explicitly uses ARR. Mixing revenue definitions produces numbers that look comparable but are not.

Step 2: Choose your profit metric

The three most common options:

MetricFormulaWhen to use
EBITDA marginEBITDA / Revenue × 100Growth-stage SaaS; standard for VC and growth equity benchmarks
Free cash flow marginOperating Cash Flow – CapEx / Revenue × 100More conservative; reflects actual cash available
Operating marginOperating Income / Revenue × 100Public company comparisons; GAAP-compliant

Pick one and stick with it. Switching between EBITDA and free cash flow to make your score look better is a common trap. It also makes trend analysis impossible.

Step 3: Add them

Worked example:

Company: B2B SaaS, $8M ARR, Series A stage

TTM revenue growth: 42%

EBITDA margin: negative 8%

Rule of 40 Score = 42 + (–8) = 34

This company scores 34 — below the threshold. It is growing quickly but burning cash to do so. Whether that is a problem depends on stage, runway, and the cost of acquiring that growth.

Second example:

Company: B2B SaaS, $45M ARR, Series C stage

TTM revenue growth: 28%

EBITDA margin: 18%

Rule of 40 Score = 28 + 18 = 46

This company scores 46 — well above the threshold. It is growing at a healthy clip while generating meaningful profit. This is the profile public market investors reward most consistently.

Benchmarks by Stage

The Rule of 40 is not a one-size-fits-all target. What is reasonable at seed is not reasonable at Series C. Here are the ranges we see in practice, based on data from OpenView Partners, SaaS Capital, and our own operator conversations.

StageTypical ARRRevenue GrowthProfit MarginRule of 40 Range
Seed$0–$1M100–300%Negative 50–100%0–50 (high variance)
Series A$1M–$5M80–150%Negative 30–50%30–70
Series B$5M–$20M50–100%Negative 10–20%35–60
Series C$20M–$75M30–60%0–15%35–55
Growth / Pre-IPO$75M–$200M20–40%10–25%40–60
Public$200M+10–30%15–35%35–55

Two patterns are worth noting. First, early-stage companies often score above 40 on growth alone. A seed-stage company growing at 150% with negative 80% margin scores 70. That does not mean it is healthier than a Series C company at 45. It means the metric is less meaningful when profit is deeply negative — the "profit" component is swamped by the growth component.

Second, the most valuable public SaaS companies tend to sit in the 45–60 range. Scores above 60 are rare and often temporary — they typically reflect either an unsustainable growth spike or a one-time margin expansion that cannot be repeated. Scores below 35 at the public stage are associated with lower valuations, higher churn risk, and greater vulnerability to economic downturns.

For operators, the practical takeaway is: know your stage, know your peer set, and track your trend. A Series B company moving from 32 to 41 over four quarters is a better story than a company that has been stuck at 45 for two years.

When the Rule of 40 Is Misleading

The Rule of 40 is a useful filter. It is not a complete picture. Here are the five situations where it misleads most often.

1. It ignores capital efficiency

A company can score 50 on the Rule of 40 while burning $3 for every $1 of new ARR it adds. The burn multiple — net burn divided by net new ARR — captures this. A burn multiple above 2.0 means the company is buying growth inefficiently, even if the Rule of 40 looks healthy. In 2022–2023, several high-profile SaaS companies that looked strong on the Rule of 40 collapsed because their burn multiples were unsustainable.

2. It ignores the quality of revenue

Not all revenue is equal. A company with 90% contracted annual recurring revenue, low churn, and strong expansion revenue is fundamentally different from a company with the same top-line number but 40% usage-based revenue, high churn, and no expansion. The Rule of 40 treats both as identical. Net revenue retention (NRR) and gross revenue retention (GRR) are essential companions.

3. It can be gamed

A company can improve its Rule of 40 score by cutting R&D or sales and marketing spend. This raises short-term profit margin while damaging long-term growth. The score goes up. The business gets weaker. This is why the Rule of 40 should always be viewed alongside growth trajectory and investment levels — not in isolation.

4. It ignores balance sheet risk

A company with a strong Rule of 40 score and $200M in debt is not the same as a company with the same score and no debt. The metric says nothing about leverage, cash reserves, or covenant compliance. In a rising-rate environment, balance sheet strength can matter more than operating metrics.

5. It treats all paths to 40 as equal

A company at 10% growth and 30% margin is a cash cow. A company at 50% growth and negative 10% margin is a growth engine. Both score 40. The investment thesis for each is completely different. The Rule of 40 does not distinguish between them — you have to.

"The Rule of 40 tells you whether to look closer. It does not tell you what you will find."

Growth-Heavy vs Profit-Heavy Paths

Every company that hits the Rule of 40 does so through some combination of growth and profit. The mix matters. It signals strategy, risk profile, and investor appeal. Here is how to think about the four quadrants.

High growth, high profit (the ideal)

Companies in this quadrant score 50 or above with both components strong — for example, 30% growth and 25% margin. These are the businesses every investor wants. They are rare. They typically have strong product-market fit, efficient go-to-market motions, and pricing power. Examples at scale include companies like Veeva Systems and Adobe at various points in their maturity.

High growth, low profit (the classic venture bet)

Companies here score 40 or above primarily through growth — for example, 60% growth and negative 15% margin, scoring 45. This is the standard profile for Series A and B SaaS companies. The bet is that growth will eventually convert to profit as the business scales and fixed costs are absorbed. The risk is that the conversion never happens — that the growth was bought, not earned, through unsustainable discounting or excessive sales and marketing spend.

Low growth, high profit (the cash cow)

Companies here score 40 through margin — for example, 10% growth and 35% margin, scoring 45. These businesses are often mature, dominant in a niche, or underinvesting in growth. They generate cash but may be losing market share to faster-growing competitors. For private equity buyers, this profile is attractive. For venture investors, it is a signal that the growth story is over.

Low growth, low profit (the danger zone)

Companies here score below 30. They are growing slowly and not generating profit. This is the hardest quadrant to justify. The business may be in a turnaround, facing competitive pressure, or simply poorly run. At the public stage, these companies trade at significant discounts and are often acquisition targets or restructuring candidates.

ProfileGrowthMarginScoreInvestor view
High growth, high profit30%25%55Premium valuation; the ideal
High growth, low profit60%Negative 15%45Venture bet; conversion risk
Low growth, high profit10%35%45Cash cow; PE-friendly
Low growth, low profit12%5%17Danger zone; needs turnaround

The path a company takes to 40 is not fixed. Many successful SaaS businesses start in the high-growth, low-profit quadrant and migrate toward high growth, high profit as they scale. The key is whether the migration is deliberate and sustainable — or forced by a funding crunch.

How to Improve Your Rule of 40 Score

You have two levers: grow faster or improve profitability. Most companies should work both simultaneously, but the emphasis depends on stage and runway.

Growth levers

Improve net revenue retention (NRR). Expansion revenue is the cheapest growth there is. A 1% improvement in NRR can add 5–10 points to your Rule of 40 score over two years, depending on your base. Focus on upsell motion, usage-based pricing that grows with customer value, and churn reduction.

Shorten sales cycles. Every week removed from the sales process improves capital efficiency and accelerates revenue recognition. Audit your pipeline for bottlenecks — common culprits include excessive stakeholder approvals, unclear pricing, and trial periods that are too long.

Improve win rates. A 5-point improvement in win rate can increase growth rate by 10–15% without adding a single dollar to sales and marketing spend. The fastest way to improve win rates is better qualification — stop pursuing deals that will not close.

Enter adjacent markets. New customer segments, geographies, or use cases can reignite growth in a maturing business. The risk is distraction — only pursue adjacencies where you have a genuine right to win, not just a desire for more TAM.

Profitability levers

Audit cost of revenue. Cloud infrastructure is often the largest line item in SaaS COGS. A systematic review of AWS or GCP spend typically yields 15–25% savings through reserved instances, right-sizing, and eliminating unused resources. These savings flow directly to margin.

Renegotiate vendor contracts. Most SaaS companies are paying for tools they do not use at volumes they do not need. A quarterly vendor audit — reviewing every subscription for active usage — typically recovers 10–20% of tool spend.

Evaluate headcount ROI. Every role should produce a measurable output. Functions that do not — or that produce output that does not move a key metric — are candidates for restructuring. This is not about cutting for the sake of cutting. It is about aligning cost structure with value creation.

Improve pricing and packaging. Most SaaS companies underprice. A 10% price increase, if it holds retention, flows almost entirely to margin because it requires no additional cost. Test pricing changes on new customers first, then roll to existing customers at renewal.

In our experience, companies that focus on both levers simultaneously can move their Rule of 40 score 5–10 points in 12 months. Companies that focus on only one lever often see the other deteriorate — growth investments depress margin, or margin cuts stall growth.

Rule of 40 vs Other SaaS Benchmarks

The Rule of 40 is one metric in a broader SaaS metrics framework. No operator should rely on it alone. Here is how it compares to the other benchmarks investors check.

MetricWhat it measuresWhen it is more useful than Rule of 40
LTV:CAC ratioCustomer lifetime value vs. acquisition costEvaluating sales and marketing efficiency; a company can pass Rule of 40 with terrible unit economics
Burn multipleCash burned per dollar of net new ARRAssessing capital efficiency; Rule of 40 ignores how much cash growth consumes
Net revenue retentionRevenue from existing customers including expansion and churnEvaluating revenue quality; Rule of 40 treats all revenue as equal
CAC payback periodMonths to recover customer acquisition costAssessing near-term cash flow; critical for companies with limited runway
Gross marginRevenue minus cost of goods soldEvaluating product economics; Rule of 40 uses operating margin, which includes S&M and R&D
Magic numberNet new ARR per dollar of sales and marketing spendEvaluating S&M efficiency specifically; more granular than Rule of 40

The right approach is to track the Rule of 40 as a headline metric and use the others as diagnostics. If your Rule of 40 score is 42 but your burn multiple is 3.5, you have a problem the headline number hides. If your score is 38 but your NRR is 125% and your CAC payback is 8 months, you may be healthier than the score suggests.

For a deeper look at the metrics investors open the data room to read first, see our guide on SaaS unit economics.

How Fairview Helps Track the Rule of 40

Fairview is built for operators who need their numbers organized and their decisions prepared — not for data teams building custom models. The Rule of 40 is a metric that benefits from continuous tracking, not quarterly calculation. Here is how Fairview supports that.

The Operating Dashboard connects to your CRM (HubSpot, Salesforce, Pipedrive), finance tools (Stripe, QuickBooks, Xero), and other data sources through the Data Connection Layer. Revenue data from Stripe and pipeline data from your CRM are normalized into a single model — so the revenue number you use for growth rate calculations is the same number your sales leader sees in the pipeline view.

Margin Intelligence pulls cost data from connected accounting tools and revenue data from payment processors. It calculates contribution margin by channel, campaign, and product line — the inputs you need for an accurate profit margin component. Without a finance integration, Fairview shows revenue and pipeline. With one, it shows full margin.

The Weekly Operating Report arrives every Monday with revenue vs. forecast, margin vs. prior period, and the top anomalies detected that week. For operators tracking the Rule of 40, this means you are not calculating the metric manually at month-end. You are watching the components move in real time — and catching drift before it becomes a quarterly surprise.

The Forecast Confidence Engine produces a confidence-weighted revenue forecast based on pipeline stage, historical close rates, and deal velocity. This helps you validate your growth rate assumptions: is the 40% growth rate in your Rule of 40 calculation supported by the pipeline, or is it an aspiration?

Fairview does not replace the judgment required to interpret the Rule of 40. It replaces the manual work of assembling the numbers — and surfaces the anomalies that tell you whether the story behind the score is strengthening or weakening.

How do you calculate the Rule of 40?

Take your trailing-twelve-month revenue growth rate (expressed as a percentage) and add your EBITDA margin or free cash flow margin (also as a percentage). Formula: Rule of 40 Score = Revenue Growth Rate (%) + Profit Margin (%). A company growing at 30% with a 15% EBITDA margin scores 45 — above the threshold.

Is the Rule of 40 still relevant in 2026?

Yes, but with caveats. The Rule of 40 remains a standard benchmark for investors evaluating SaaS companies at Series B and beyond. However, it should not be used in isolation. It ignores capital efficiency (a company can score above 40 while burning unsustainable amounts of cash), balance sheet strength, and the quality of revenue (contracted vs. usage-based).

What is a good Rule of 40 score by company stage?

Seed-stage companies typically score below 40 because they prioritize growth over profitability. Series A companies often land in the 30–50 range. Series B and C companies should target 40 or above. Public SaaS companies with a Rule of 40 score above 50 typically trade at revenue multiples 2–3× higher than those below 30, according to analysis by SaaS Capital and OpenView Partners.

Can a company pass the Rule of 40 and still be unhealthy?

Yes. A company growing at 60% with a negative 10% margin scores 50 — well above the threshold — but may be burning cash faster than it can raise it. The Rule of 40 also rewards unsustainable growth funded by excessive discounting, and it ignores balance sheet risk. It is a screening tool, not a diagnostic.

Should I use EBITDA or free cash flow for the profit margin?

Either works, but be consistent. EBITDA is more common for growth-stage SaaS because it strips out depreciation and amortization, which can distort the picture for asset-light software businesses. Free cash flow is more conservative and reflects actual cash available. If you compare your score to public benchmarks, use the same metric the benchmark uses.

How can I improve my Rule of 40 score?

You have two levers: grow faster or improve profitability. To grow faster, focus on net revenue retention (expansion revenue is cheaper than new acquisition), reduce sales cycle length, and improve win rates. To improve profitability, audit your cost of revenue for cloud infrastructure waste, renegotiate vendor contracts, and evaluate whether every headcount produces measurable output. Most companies can move the number 5–10 points in 12 months by working both levers.

Key Takeaways

  • The Rule of 40 is a simple, powerful filter: add your revenue growth rate to your profit margin. A score of 40 or above signals that your SaaS business is healthy enough to justify continued investment.
  • The metric treats different paths to 40 as equivalent — high growth with losses, or slow growth with high profit. The mix matters as much as the total. Know which quadrant you are in and whether your strategy matches it.
  • Benchmarks vary by stage. Seed companies often score above 40 on growth alone. Series B and C companies should target the threshold itself. Public companies above 50 command meaningfully higher valuations.
  • The Rule of 40 ignores capital efficiency, revenue quality, and balance sheet risk. Always pair it with burn multiple, NRR, and CAC payback for a complete picture.
  • Most companies can move their score 5–10 points in 12 months by working both growth and profitability levers simultaneously — not by optimizing one at the expense of the other.

If you are ready to track the Rule of 40 alongside your other SaaS metrics — with revenue, margin, and pipeline data in one view and anomalies surfaced automatically — Fairview connects your CRM, finance, and operating data into a single operating view. Book a demo to see how it works for your business.

Fairview · Free for 14 days

Turn this into action — automatically.

Connect your CRM, finance, and ad data. Fairview surfaces margin leaks, pipeline risk, and next-best actions every week.

No credit card · Setup in under 10 minutes

Frequently asked questions

What is the Rule of 40 in SaaS?

The Rule of 40 is a simple health check for SaaS companies. You add your revenue growth rate (year-over-year) to your profit margin (EBITDA or free cash flow). If the sum is 40 or higher, your business passes the threshold. If it is below 40, you are either growing too slowly, not profitable enough, or both.

Stop reading. Start making decisions.

Connect your stack, see your operating picture, act on what matters. First source live in 10 minutes.