TL;DR
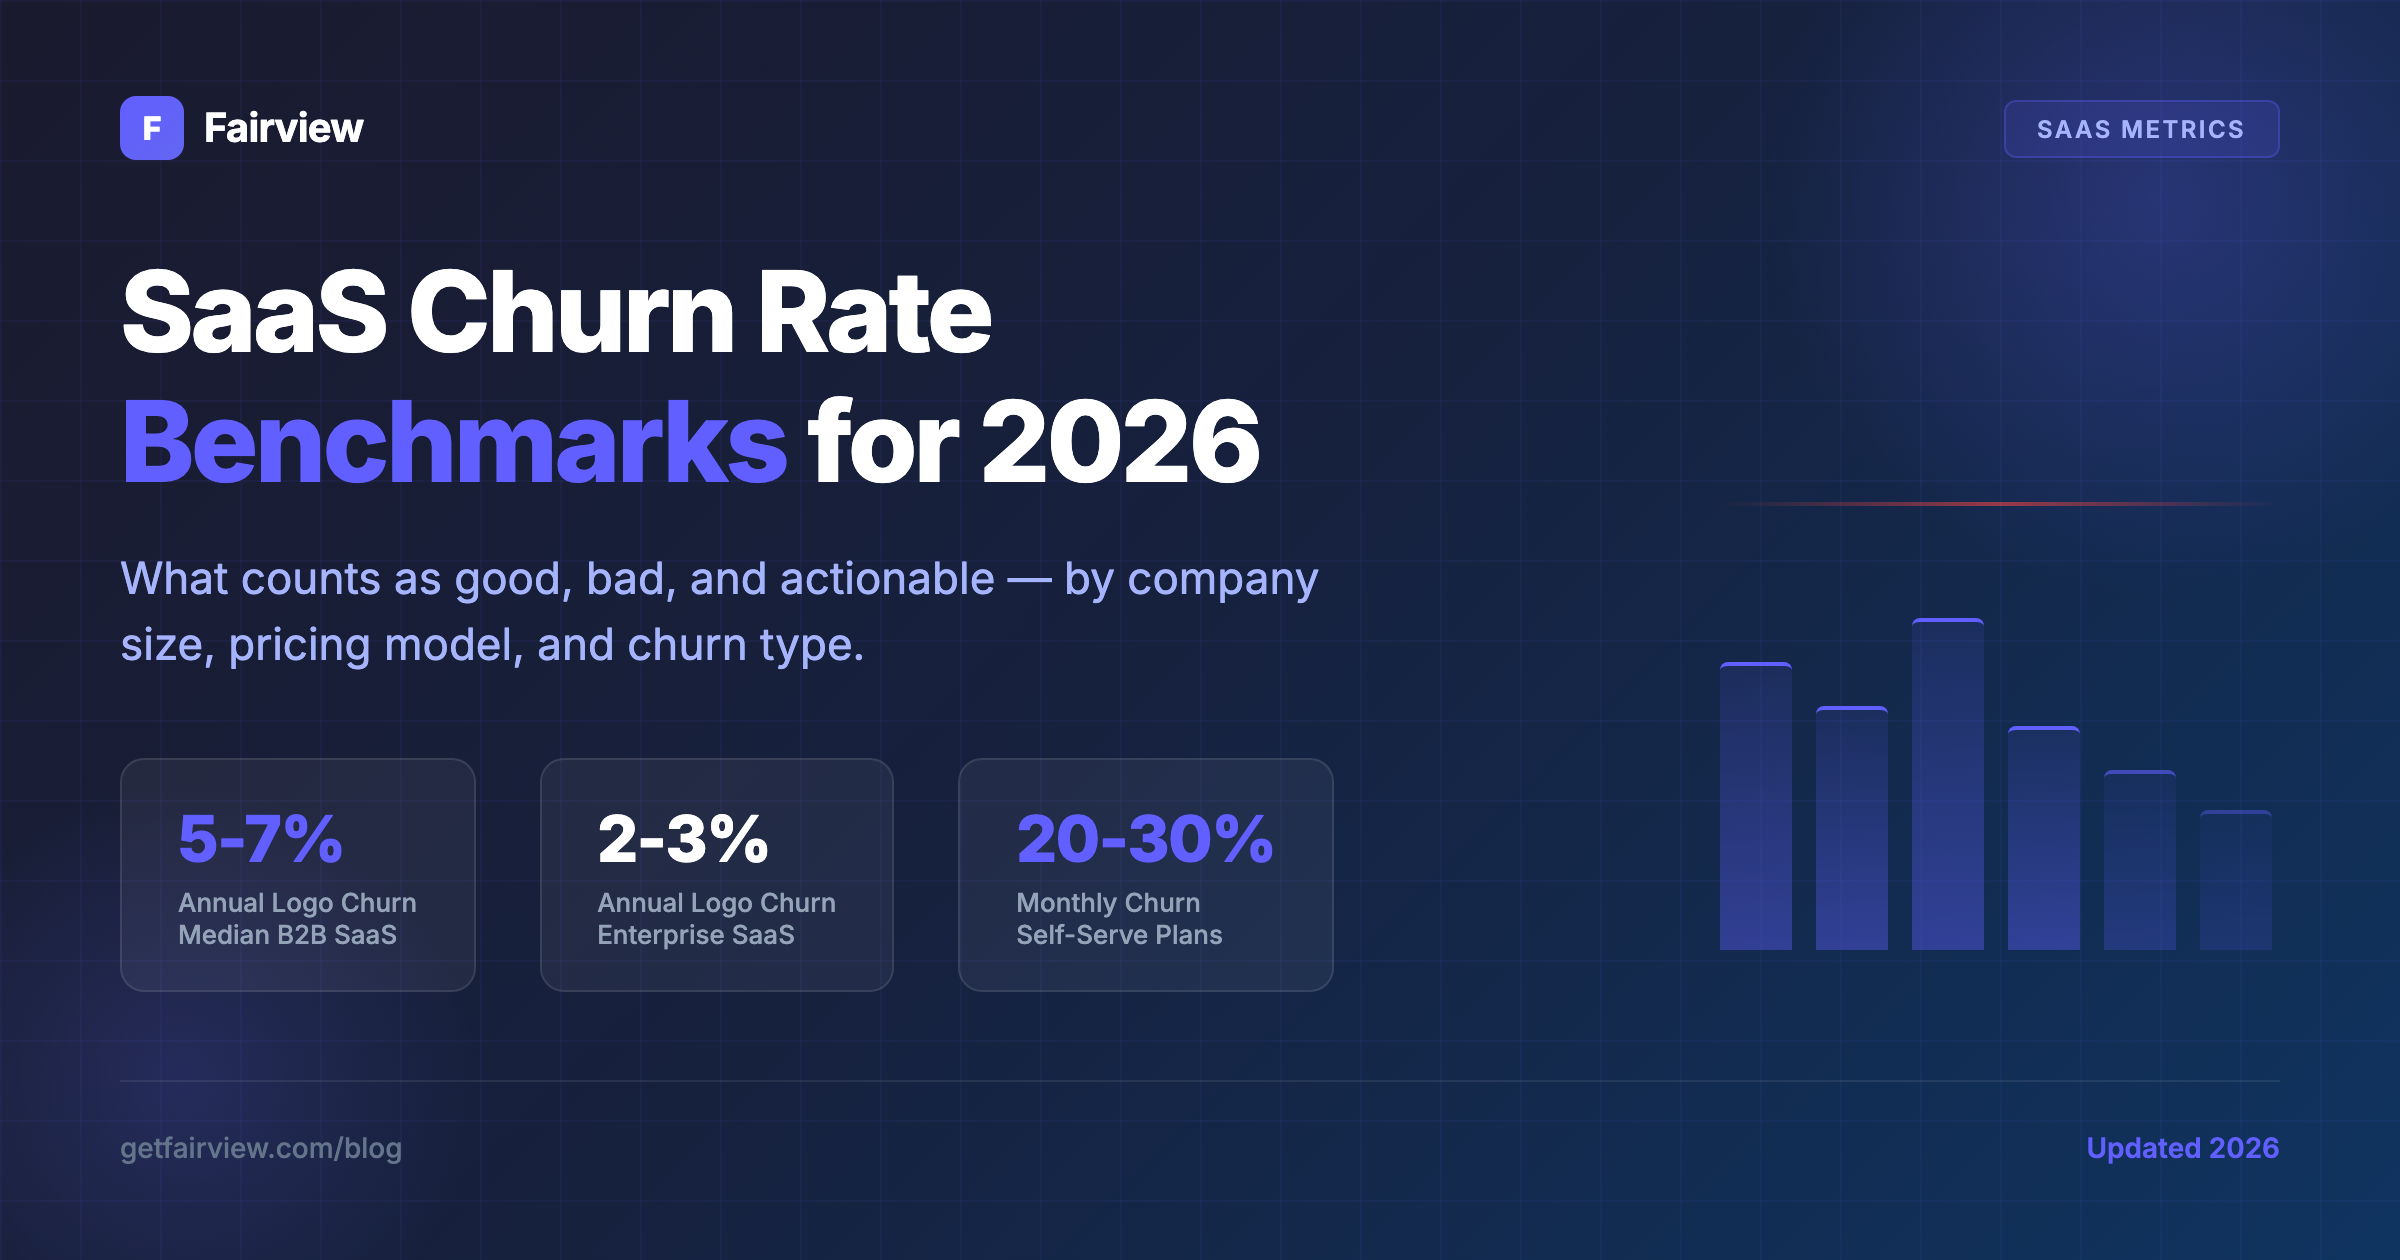
- Benchmarks: B2B SaaS annual logo churn of 5–7% is median performance. Enterprise SaaS at 2–3% is strong. Self-serve and B2C SaaS monthly churn of 5–7% is typical.
- Two metrics: Logo churn counts lost customers. Revenue churn counts lost dollars. Revenue churn is the stronger health indicator — a company can lose few customers but significant revenue, or many small customers with minimal revenue impact.
- Voluntary vs involuntary: Voluntary churn signals product or customer success gaps. Involuntary churn (failed payments) signals billing infrastructure gaps. The latter is easier to fix and accounts for 20–40% of total churn in most SaaS businesses.
- Five ways to reduce churn: Improve onboarding, segment and intervene early, fix payment failures, expand existing accounts, and align pricing with value delivered.
- When churn is OK: Early-stage product-market fit testing, annual plans with high upfront payment recovery, and businesses where acquisition outpaces churn. Sustained high churn in mature SaaS is a structural problem.
A SaaS company at $5M ARR with 7% annual churn loses $350K in recurring revenue every year just from customers leaving. At 15% annual churn, that number doubles to $750K. The difference between acceptable and unacceptable churn is not a matter of opinion — it is a matter of arithmetic, and the arithmetic gets worse as the company scales.
This guide gives you the 2026 benchmarks for SaaS churn rate by company size, pricing model, and contract type. You will learn how to calculate churn correctly, why logo churn and revenue churn tell different stories, when high churn is actually defensible, and five specific actions that reduce churn in practice — not in theory.
Definition
Churn rate is the percentage of customers or recurring revenue that a business loses in a given time period. It is the inverse of retention. For SaaS companies, churn is typically measured monthly or annually and expressed as a percentage of starting customers (logo churn) or starting recurring revenue (revenue churn).
What is churn rate?
Churn rate measures how fast your customer base or revenue base shrinks. It is the most direct signal of whether your product retains the customers it acquires. A low churn rate means customers stay. A high churn rate means customers leave — and every departing customer takes future revenue with them.
There are two primary types of churn that every SaaS operator must track separately.
Logo churn measures the percentage of customers who cancel. If you start the quarter with 100 customers and 5 cancel, your quarterly logo churn is 5%. This metric tells you how many relationships you are losing. It is the metric most investors ask about first.
Revenue churn measures the percentage of recurring revenue that is lost. If you start the quarter with $100K in monthly recurring revenue and lose $5K from canceled accounts, your monthly revenue churn is 5%. This metric tells you how much money you are losing. It is the metric that determines whether your business grows or shrinks.
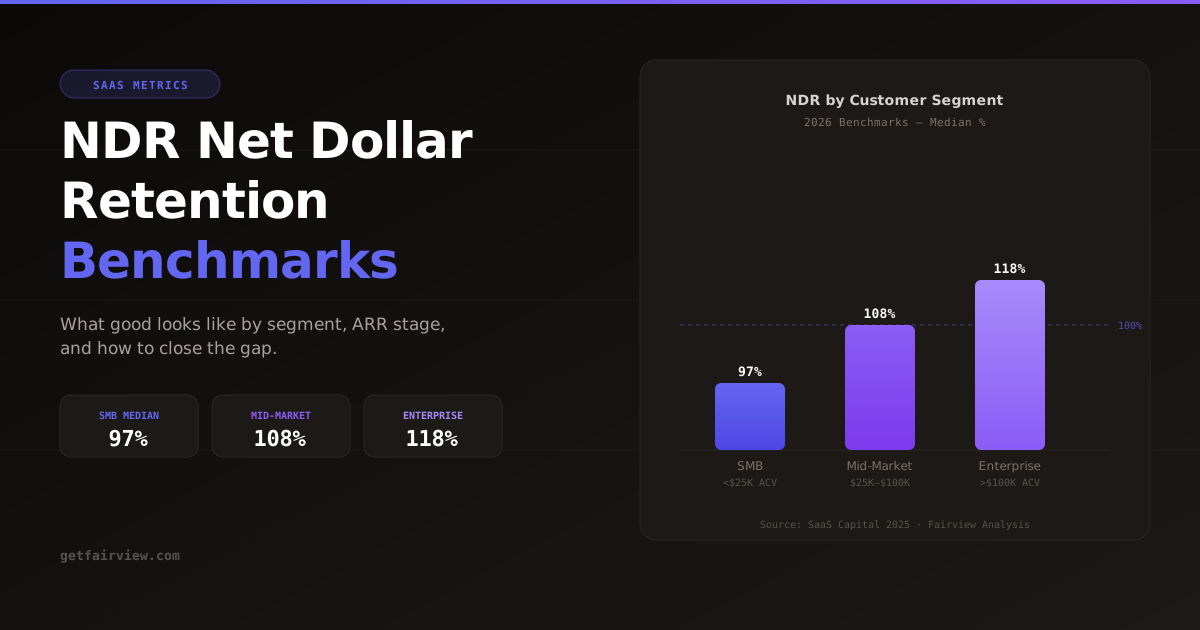
A third concept — net revenue retention — combines revenue churn with expansion revenue (upsells, cross-sells, and usage growth). Net revenue retention above 100% means your existing customer base generates more revenue this period than last period, even after accounting for churn. This is the gold standard for SaaS health. For a deeper look at this metric, see our guide on net dollar retention benchmarks.
Churn also splits into voluntary and involuntary categories. Voluntary churn is the customer choosing to leave. Involuntary churn is the customer leaving because of a failed payment, expired card, or billing error. The distinction matters because the fixes are entirely different.
How to calculate churn
The formula for churn is simple. The execution is where most companies make mistakes.
Logo churn rate formula:
Revenue churn rate formula:
Worked example:
Imagine a SaaS company with 200 customers and $40K in monthly recurring revenue at the start of March. During March, 8 customers cancel. Those 8 customers accounted for $3,200 in MRR.
Monthly logo churn = (8 / 200) × 100 = 4%
Monthly revenue churn = ($3,200 / $40,000) × 100 = 8%
Notice that revenue churn (8%) is double logo churn (4%). This means the churned customers had above-average contract values. This pattern is common when larger accounts churn — and it is a more serious problem than the logo churn rate suggests.
Common calculation mistakes:
- Using end-of-period customer count as the denominator. This understates churn if you are growing. Always use the start-of-period count.
- Counting downgrades as churn. A downgrade reduces revenue but does not remove the customer. Track downgrades separately as contraction, not churn.
- Mixing monthly and annual contracts in the same calculation. Annual contracts have different churn patterns than monthly contracts. Segment your calculation by contract type.
- Annualizing monthly churn by multiplying by 12. This produces inaccurate results because churn compounds. Use (1 − Monthly Churn Rate)^12 − 1 for proper annualization.
For a 4% monthly logo churn rate, the proper annualized rate is (1 − 0.04)^12 − 1 = 38.7% — not the 48% you would get from simple multiplication. The difference is significant and affects every growth model you build.
Logo churn vs revenue churn
Logo churn and revenue churn measure different things. Both matter. But revenue churn is the stronger predictor of business health.
| Dimension | Logo Churn | Revenue Churn |
|---|---|---|
| What it measures | Percentage of customers lost | Percentage of recurring revenue lost |
| Formula | Lost customers / Starting customers | Lost MRR / Starting MRR |
| Best for | Customer success team KPIs | Investor reporting and growth modeling |
| When it overstates health | When small customers churn but large ones stay | When downgrades are counted as retention |
| When it understates health | When large customers churn | When expansion hides high gross churn |
Consider two companies with identical 5% quarterly logo churn.
Company A loses 5 small customers paying $100/month each. Revenue impact: $500/month. Revenue churn: 1.25%.
Company B loses 5 enterprise customers paying $5,000/month each. Revenue impact: $25,000/month. Revenue churn: 12.5%.
Same logo churn. Entirely different business outcomes. This is why revenue churn appears in every serious SaaS unit economics analysis that investors run.
The relationship between the two metrics also reveals customer concentration risk. If your revenue churn is consistently higher than your logo churn, your revenue is concentrated in a small number of large accounts. Losing any one of them is a material event. Diversification — either through account growth or pricing structure — reduces this risk.
Benchmarks by company size
Churn benchmarks vary significantly by company stage, average contract value, and target customer. The table below shows median annual logo churn rates for B2B SaaS companies in 2026, based on published data from OpenView Partners, KeyBanc Capital Markets, and SaaS Capital surveys.
| Company Stage | ARR Range | Annual Logo Churn | Annual Revenue Churn | Assessment |
|---|---|---|---|---|
| Early-stage seed | $0–$1M | 10–15% | 8–12% | High but expected — focus is product-market fit, not retention optimization |
| Growth-stage | $1M–$10M | 6–10% | 5–8% | Improvement signal — onboarding and CS investments start showing returns |
| Scale-stage | $10M–$50M | 5–7% | 4–6% | Median B2B SaaS performance — room to improve but not a crisis |
| Enterprise | $50M+ | 2–3% | 1–3% | Strong performance — annual contracts and dedicated CSMs drive retention |
These are median figures. Top-quartile performers at every stage achieve churn rates 30–50% lower than the median. A scale-stage company with 3% annual logo churn is in the top quartile. A growth-stage company with 4% annual logo churn is exceptional.
Contract value is an even stronger predictor of churn than company size. The table below shows churn by annual contract value (ACV).
| Annual Contract Value | Annual Logo Churn | Typical Sales Motion |
|---|---|---|
| Below $1,000 | 15–25% | Self-serve, product-led |
| $1,000–$5,000 | 8–12% | Low-touch sales, inside sales |
| $5,000–$25,000 | 5–8% | Mid-market sales, CS touch |
| $25,000–$100,000 | 3–5% | Named account management |
| Above $100,000 | 1–3% | Enterprise sales, dedicated CSM |
The pattern is clear: higher ACV correlates with lower churn. This is not because expensive products are inherently stickier. It is because higher-ACV products typically involve more human touch during onboarding, more contractual commitment (annual vs. monthly), and deeper integration into the customer's workflow.
Benchmarks by pricing model
How you price your product affects churn as much as what your product does. The pricing model shapes customer commitment, payment friction, and expansion opportunity.
| Pricing Model | Monthly Logo Churn | Annual Logo Churn | Key Driver |
|---|---|---|---|
| Self-serve / product-led | 5–7% | 46–58% | Low friction to leave, low switching cost |
| Monthly subscription | 3–5% | 31–46% | Medium commitment, easy cancellation |
| Annual subscription | 0.4–0.8% | 5–10% | Contractual lock-in, upfront payment |
| Usage-based | 2–4% | 22–38% | Revenue scales with customer success |
| Seat-based (per user) | 2–4% | 22–38% | Expansion through team growth |
| Hybrid (seat + usage) | 1.5–3% | 16–30% | Multiple expansion levers, higher stickiness |
Annual contracts show the most dramatic improvement over monthly. A company moving from monthly to annual billing typically sees annual churn drop from 35–45% to 5–10%. The trade-off is slower initial growth — annual contracts require more sales effort and longer decision cycles.
Usage-based pricing introduces a different dynamic. Churn rates are moderate, but revenue churn can be negative if customer usage grows faster than account losses. Companies like AWS and Snowflake built massive businesses on this model. The risk: if customer usage declines, revenue follows immediately — there is no contractual floor.
Seat-based pricing creates natural expansion paths. As the customer's team grows, they buy more seats. This produces negative revenue churn even with moderate logo churn. The risk: seat-based pricing caps revenue per customer at team size, which limits upside for products that deliver value independent of headcount.
Voluntary vs involuntary churn
Not all churn reflects a customer decision to leave. A significant portion — typically 20–40% of total churn — is involuntary: failed payments, expired credit cards, billing system errors, and dunning failures.
Voluntary churn is the customer choosing to cancel. The causes include:
- Poor onboarding — the customer never reaches the activation milestone
- Product-market fit gap — the product does not solve the customer's actual problem
- Competitive switching — a competitor offers better features, pricing, or service
- Stakeholder departure — the internal champion leaves the company
- Unmet expectations — the customer expected outcomes the product does not deliver
Involuntary churn is the customer losing access without choosing to leave. The causes include:
- Expired or replaced credit card
- Insufficient funds at billing time
- Bank fraud protection blocking the charge
- Outdated billing information after company acquisition or reorganization
- Dunning process failing to contact the right person
The fix for involuntary churn is operational, not strategic. It includes:
- Pre-dunning emails before card expiration
- Multiple retry attempts with intelligent timing
- In-app payment update prompts before suspension
- Account manager outreach for high-value accounts
- Grace periods that preserve access during payment resolution
Companies that fix involuntary churn typically recover 30–50% of would-be lost revenue with minimal product changes. This is the highest-ROI churn reduction action available to most SaaS operators.
5 ways to reduce churn
Reducing churn is not a single initiative. It is a set of coordinated actions across onboarding, customer success, product, and billing. Here are five approaches that produce measurable results.
1. Fix onboarding within the first 14 days
Most churn is decided early. Data from multiple SaaS studies shows that customers who do not reach a core activation milestone within 14 days are 3–5x more likely to churn than those who do. The activation milestone varies by product: first report generated, first integration connected, first campaign launched, first team member invited.
The fix is specific: identify the activation milestone that correlates with retention, then design onboarding to get every customer to that milestone as fast as possible. Remove friction. Add progress indicators. Send targeted emails at days 3, 7, and 10 with specific next steps. Offer a live onboarding call for accounts above a threshold.
2. Segment customers and intervene before they churn
Not all customers show the same churn signals. A high-value enterprise account might churn after 90 days of declining usage. A self-serve account might churn after one failed login. Segment your customer base by value, behavior, and risk signals — then build intervention playbooks for each segment.
Common early warning signals include: declining login frequency, reduced feature usage, support ticket volume spikes, NPS score drops, missed quarterly business reviews, and payment method nearing expiration. The operators who reduce churn fastest are the ones who build automated alerts on these signals and assign specific actions to specific team members.
3. Eliminate involuntary churn through payment infrastructure
As discussed above, 20–40% of churn is involuntary. Fixing it requires no product changes and minimal engineering effort. Update your dunning sequence. Add in-app payment update prompts. Extend grace periods for high-value accounts. The revenue recovered is immediate.
4. Expand existing accounts through usage and seats
The most powerful way to offset churn is to make it mathematically irrelevant. If your net revenue retention is above 100%, you grow even when customers leave. Expansion revenue comes from three sources: usage growth (the customer uses more of your product), seat growth (the customer's team grows), and upsells (the customer upgrades to a higher tier).
Pricing models that support expansion — usage-based, seat-based, or tiered feature access — make this easier. But even flat-rate products can drive expansion through add-ons, professional services, and new product lines.
5. Align pricing with value delivered
Customers churn when the price exceeds the perceived value. The most common cause is not that the product is too expensive — it is that the customer does not see the value. This happens when pricing is disconnected from outcomes.
Value-based pricing ties cost to the result the customer gets: revenue generated, time saved, deals closed, costs reduced. When customers see a direct link between what they pay and what they gain, price becomes a non-issue. When they do not, even a fairly priced product feels expensive — and churn follows.
For a broader view of the customer success metrics that predict and prevent churn, see our detailed guide on the signals that matter.
When churn is actually OK
Not all churn is bad. There are three situations where elevated churn is acceptable — even expected.
1. Early-stage product-market fit testing
A seed-stage company with 15% annual churn is not necessarily failing. It may be learning which customers fit and which do not. The goal at this stage is not to retain everyone — it is to identify the segment that stays, then focus acquisition on that segment. Churn is data. High churn with clear segment patterns is actionable data.
The danger signal is not high churn. It is high churn with no segment pattern — every type of customer leaves at similar rates. That suggests a product problem, not a targeting problem.
2. Annual plans with high upfront payment
A company that sells annual contracts and collects full payment upfront can tolerate higher churn than a monthly-subscription company. The reason: the customer has already paid for the year. The company recovers its customer acquisition cost before the churn event occurs.
This is why many SaaS companies offer 15–20% discounts for annual payment. The discount is not a margin sacrifice — it is a churn hedge. The company trades margin for certainty.
3. Businesses where acquisition outpaces churn
In high-growth markets with low customer acquisition costs, a company can grow rapidly even with moderate churn. The arithmetic is simple: if you acquire 100 customers per month at $50 CAC and lose 5% monthly to churn, you grow as long as acquisition stays above churn.
This model works until the market saturates or CAC rises. At that point, the company must fix retention or growth stalls. The operators who survive transitions from high-growth to mature markets are the ones who built retention infrastructure early.
How Fairview predicts and prevents churn
Churn management is a data problem before it is a customer success problem. You cannot intervene with at-risk customers if you do not know which customers are at risk. Fairview addresses this by connecting the data sources that contain churn signals and surfacing specific actions before cancellation occurs.
Detecting churn signals across connected data
Fairview connects to your CRM (HubSpot, Salesforce, Pipedrive), payment processor (Stripe), and connected tools to build a unified view of account health. The platform monitors signals that precede churn: declining usage patterns, missed payment events, support ticket trends, and engagement drops. These signals appear in the Operating Dashboard alongside your other operating metrics — margin, pipeline, and forecast.
The Next-Best Action Engine
When Fairview detects a churn risk signal, the Next-Best Action Engine generates a specific recommendation. Not a generic alert — a named action with an assigned owner. Examples include: "Account XYZ has not logged in for 21 days. Schedule a check-in call." Or: "Three accounts on the Starter plan have hit usage limits. Propose upgrades before month-end."
This shifts churn management from reactive to proactive. Instead of discovering churn in your monthly report, you discover the risk signal in time to act on it.
Connecting churn to the full operating picture
Churn does not exist in isolation. It connects to CAC payback, LTV, and unit economics. Fairview surfaces these connections: if churn rises 2 percentage points, what happens to CAC payback? If you reduce churn by 1 percentage point, what is the revenue impact over 12 months? These are the calculations that turn churn from a customer success metric into an operating priority.
For operators who want to see how churn fits into the full Fairview operating view, the platform connects CRM, finance, and pipeline data into one dashboard — with churn risk surfaced alongside revenue, margin, and forecast confidence.
Key takeaways
- Annual logo churn of 5–7% is median performance for B2B SaaS. Enterprise SaaS should target 2–3%. Self-serve SaaS monthly churn of 5–7% is typical but should improve over time.
- Revenue churn is more important than logo churn. A company can lose few customers but significant revenue, or many small customers with minimal revenue impact. Track both, but prioritize revenue churn in growth models.
- Involuntary churn accounts for 20–40% of total churn and is the easiest to fix. Payment infrastructure improvements — dunning, retries, in-app prompts — recover revenue with minimal product changes.
- Churn benchmarks vary by ACV more than by company size. Companies with ACV above $10K average 4–6% annual churn. Companies below $1K average 15–25%. The difference is sales motion and onboarding depth, not product quality.
- Annual contracts, usage-based pricing, and seat-based expansion all reduce effective churn. The strongest SaaS businesses combine multiple pricing levers to drive negative net revenue retention.
- High churn is acceptable in early-stage product-market fit testing, annual-plan businesses with upfront payment, and high-growth markets where acquisition outpaces churn. Sustained high churn in a mature business is a structural problem that compounds over time.
If you are ready to move from tracking churn to predicting and preventing it, book a demo to see how Fairview surfaces at-risk accounts and generates specific retention actions before customers cancel.
How do you calculate churn rate?
Logo churn rate is calculated by dividing the number of customers lost in a period by the number of customers at the start of that period, then multiplying by 100. For example, if you started the month with 200 customers and lost 8, your monthly logo churn rate is 4%. Revenue churn rate divides lost MRR by starting MRR. The two metrics can differ significantly if churned customers have above-average or below-average contract values.
What is the difference between logo churn and revenue churn?
Logo churn measures the percentage of customers who cancel. Revenue churn measures the percentage of recurring revenue that is lost. A company can have low logo churn but high revenue churn if its largest accounts are leaving. Conversely, a company can have high logo churn but low revenue churn if it loses many small customers while retaining its biggest accounts. Both metrics matter, but revenue churn is the stronger predictor of long-term business health.
What is voluntary vs involuntary churn?
Voluntary churn occurs when a customer actively decides to cancel — usually due to poor product fit, competitive switching, or unmet expectations. Involuntary churn occurs when a customer loses access due to failed payment, expired credit card, or billing issues. Voluntary churn signals product or customer success problems. Involuntary churn signals payment infrastructure problems. In most SaaS businesses, involuntary churn accounts for 20–40% of total churn and is the easiest category to fix.
When is high churn actually acceptable?
High churn is acceptable in three situations: early-stage product-market fit testing, where the goal is learning who stays rather than retaining everyone; annual plans with high upfront payment, where the company recovers CAC before churn occurs; and businesses with rapid new customer acquisition that outpaces churn. Even in these cases, churn should be monitored and reduced over time. Sustained high churn in a mature SaaS business is rarely acceptable.
How does Fairview help reduce churn?
Fairview reduces churn by detecting early warning signals before customers cancel. The platform connects to your CRM, payment processor, and product data to flag accounts with declining usage, missed payments, or support ticket patterns that precede churn. The Next-Best Action Engine generates specific recommendations — which accounts to contact, which expansion opportunities to pursue, and which at-risk customers need intervention. This shifts churn management from reactive cancellation recovery to proactive retention.
What is negative churn and how do you achieve it?
Negative churn occurs when expansion revenue from existing customers exceeds revenue lost from churned customers, resulting in net revenue growth even without new sales. Achieving negative churn requires three conditions: a pricing model that supports expansion (usage-based, seat-based, or feature tiers); a product with natural upsell paths; and a customer success function that identifies and pursues expansion opportunities. Companies with negative churn can grow revenue while acquiring fewer new customers.