TL;DR
- What it is: ARR per employee divides your Annual Recurring Revenue by total full-time headcount. It tells you how much recurring revenue each person in the company generates.
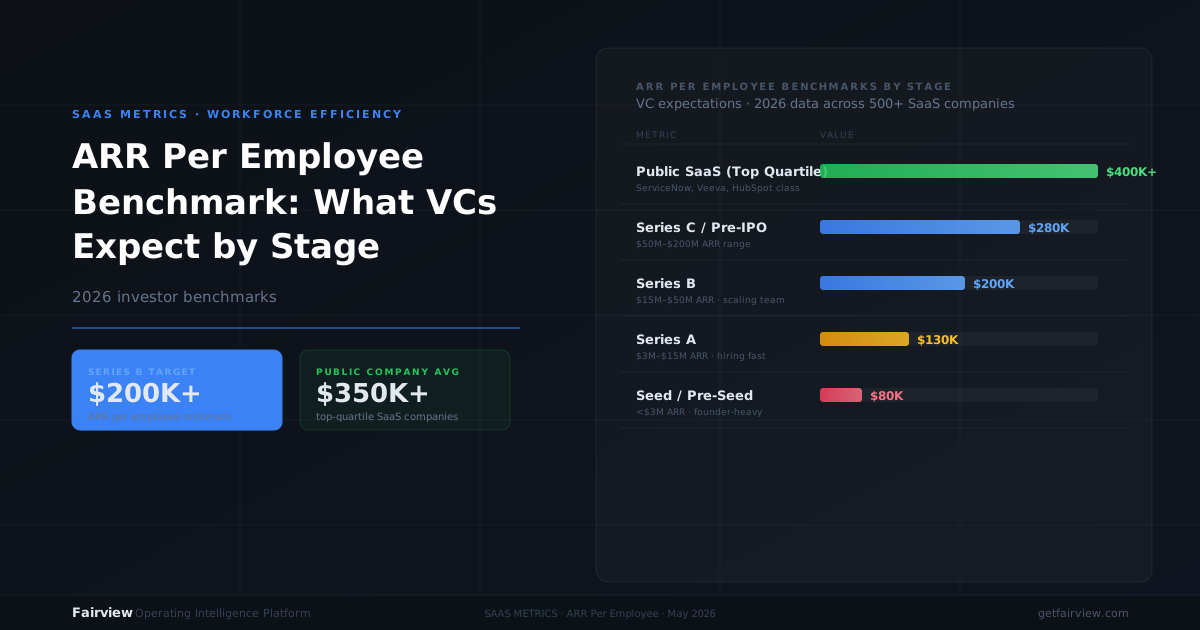
- Benchmarks by stage: Seed $100K–$250K, Series A $200K–$350K, Series B–C $350K–$500K, public SaaS $600K+. Product-led companies typically run 30–50% higher than sales-led companies at the same stage.
- When it misleads: A high number can hide underinvestment in growth. A low number can reflect deliberate hiring ahead of revenue. Always interpret the metric alongside growth rate, burn multiple, and functional coverage.
- How to improve it: Grow revenue faster than headcount through pricing, sales efficiency, automation, and churn reduction — not through headcount cuts alone.
- How Fairview helps: Fairview's Operating Dashboard surfaces workforce efficiency metrics alongside revenue, margin, and pipeline — so operators see the full picture, not a single number in isolation.
A SaaS company with $10M ARR and 40 employees generates $250K per employee. A competitor at the same ARR with 25 employees generates $400K per employee. Both can be healthy. Both can be in trouble. The number alone does not tell you which.
ARR per employee is one of the most cited workforce efficiency metrics in SaaS. Investors check it before writing term sheets. Boards track it quarterly. Operators use it to calibrate hiring pace against revenue growth. But the metric is frequently misinterpreted — praised when it is high without asking why, or punished when it is low without understanding context.
This guide explains what ARR per employee actually measures, how to calculate it correctly, what the benchmarks look like by company size and go-to-market motion, when the metric hides problems, and how to improve it without cutting your team to the bone.
What is ARR per employee?
ARR per employee is a workforce efficiency metric that divides a company's Annual Recurring Revenue by its total full-time employee count. The result tells you how much recurring revenue each person in the organization generates on average.
Definition
ARR per employee = Total Annual Recurring Revenue / Total Full-Time Employees. It measures the average recurring revenue generated by each person in the company. Higher values indicate more revenue per person; lower values indicate less. The metric is most useful when tracked over time and compared against companies with similar go-to-market motions and growth rates.
The metric is simple to calculate and easy to understand. That simplicity is both its strength and its weakness. Because it reduces a complex organization to a single ratio, it captures efficiency trends but misses nuance. A company with $500K ARR per employee might have a lean, high-performing team — or it might have a burned-out team, a stagnant product, and a hiring freeze that is masking deeper problems.
ARR per employee is most valuable when used as a directional indicator, not a standalone score. Track it quarter over quarter. Compare it to companies at a similar stage with a similar motion. And always pair it with other efficiency metrics — burn multiple, Rule of 40, and gross margin — to build a complete picture.
Why this metric matters
SaaS economics are fundamentally about leverage. The model assumes that once a product is built, each additional customer adds revenue at a low marginal cost. ARR per employee is the simplest way to measure whether that leverage is actually showing up in the business.
It signals capital efficiency. Investors in SaaS companies care deeply about how efficiently a business converts capital into revenue. A company that generates $400K per employee with $2M in annual burn is more capital-efficient than a company that generates $200K per employee with the same burn. The metric does not replace unit economics, but it provides a quick read on whether the team size matches the revenue base.
It flags over-hiring. One of the most common mistakes in growing SaaS companies is hiring ahead of demand. A CEO raises a Series A, sees a 24-month runway, and builds out a 20-person team before the product-market fit is strong enough to support it. ARR per employee drops sharply after each hiring wave. If the metric does not recover within two to three quarters, the company hired too fast.
It tracks productivity trends. When ARR per employee rises steadily, it usually means the company is finding leverage — through better product, better sales motion, or automation. When it plateaus or declines while headcount grows, it signals that new hires are not yet productive, or that the revenue engine is not scaling at the same pace as the team.
It enables cross-company comparison. Unlike metrics that require access to internal financials, ARR per employee can be estimated from public data. LinkedIn headcount plus disclosed ARR (from funding announcements, press releases, or public filings) gives a reasonable approximation. This makes it a favorite metric for investors benchmarking portfolio companies against competitors.
How to calculate it
The formula is straightforward. The inputs require care.
ARR per employee = Total ARR / Total FTEs
Step 1: Define total ARR. Use the most recent Annual Recurring Revenue figure. ARR is the annualized value of all recurring subscription contracts active at the measurement date. Do not include one-time services revenue, implementation fees, or non-recurring items. If your company reports both ARR and GAAP revenue, use ARR for this calculation. The metric is designed to measure the scalable, predictable portion of the business.
Step 2: Define total FTEs. Count all full-time employees on the payroll as of the same date. Include founders, executives, sales, engineering, marketing, customer success, operations, and administrative staff. Exclude part-time workers, contractors, and advisors unless they work full-time equivalents. Do not use "average headcount over the year" — use the current count. Hiring is lumpy, and averaging smooths over the signal you are trying to detect.
Step 3: Run the calculation.
| Company | Total ARR | Total FTEs | ARR per employee |
|---|---|---|---|
| Seed-stage SaaS | $1.5M | 12 | $125,000 |
| Series A SaaS | $6M | 22 | $273,000 |
| Series B SaaS | $18M | 45 | $400,000 |
| Growth-stage SaaS | $50M | 85 | $588,000 |
| Public SaaS (efficient) | $200M | 280 | $714,000 |
Step 4: Track it over time. A single snapshot is less useful than a trend line. Calculate ARR per employee at the end of each quarter. Plot it against headcount changes and major hiring events. The pattern matters more than any single data point.
Benchmarks by company size
Benchmarks for ARR per employee vary widely by funding stage, growth rate, and business model. The figures below represent observed medians from published SaaS benchmarking data, public company filings, and venture capital portfolio analyses. They are directional guides, not rigid targets.
| Stage | ARR range | Typical headcount | ARR per employee | Growth rate |
|---|---|---|---|---|
| Pre-seed / Seed | $0–$2M | 5–15 | $100K–$250K | 2–3× annually |
| Series A | $2M–$10M | 15–40 | $200K–$350K | 2–3× annually |
| Series B | $10M–$30M | 40–100 | $300K–$500K | 80–150% annually |
| Series C | $30M–$75M | 100–250 | $350K–$550K | 50–100% annually |
| Growth / Pre-IPO | $75M–$200M | 250–600 | $450K–$700K | 30–60% annually |
| Public SaaS (median) | $200M+ | 600–2,000 | $500K–$800K | 15–30% annually |
| Public SaaS (top quartile) | $200M+ | 600–2,000 | $800K–$1.2M+ | 20–40% annually |
These ranges reflect median performance. A company at the low end of the range is not necessarily failing — it may be investing heavily in engineering, expanding into new markets, or building out a sales team before revenue catches up. A company at the high end is not necessarily thriving — it may be underinvesting in growth, deferring critical hires, or running a team that is too thin to sustain.
The most important comparison is not against the table above. It is against your own trend line. If your ARR per employee was $300K six quarters ago and is $280K today while headcount grew 60%, you have a productivity problem. If it was $200K and is now $350K after a pricing increase and a sales efficiency initiative, you have a leverage story.
Benchmarks by go-to-market motion
Go-to-market motion is the single largest driver of ARR per employee variation within a given stage. A product-led growth company and a sales-led company at the same ARR level will have very different headcount profiles — and very different ARR per employee figures.
Product-led growth (PLG)
PLG companies acquire customers through self-serve signups, free trials, and viral distribution. They require smaller sales and marketing teams relative to revenue. Engineering and product tend to be larger as a share of headcount, but the total team is still leaner per dollar of ARR.
Typical ARR per employee for PLG companies:
| Stage | ARR per employee |
|---|---|
| Seed | $150K–$300K |
| Series A | $300K–$500K |
| Series B | $450K–$700K |
| Growth | $600K–$900K |
PLG companies at the high end of these ranges — $700K+ at Series B — are usually those with strong viral loops, low support burden, and efficient onboarding. Companies at the low end may still be building their self-serve funnel or may have invested heavily in enterprise sales as a secondary motion.
Sales-led growth
Sales-led companies acquire customers through outbound prospecting, SDR teams, account executives, and customer success managers. The revenue is higher-touch and higher-ACV, but the team required to generate it is larger.
Typical ARR per employee for sales-led companies:
| Stage | ARR per employee |
|---|---|
| Seed | $80K–$180K |
| Series A | $180K–$300K |
| Series B | $280K–$450K |
| Growth | $400K–$650K |
The wider range at each stage reflects the variability in sales efficiency. A sales-led company with a well-tuned outbound machine, strong win rates, and fast ramp times will sit at the high end. One with high SDR turnover, long sales cycles, and low quota attainment will sit at the low end.
Hybrid motion
Most SaaS companies today use a hybrid motion — product-led for small customers, sales-led for enterprise. ARR per employee in hybrid companies typically falls between the PLG and sales-led ranges, weighted toward whichever motion drives the majority of revenue. A company generating 70% of ARR through self-serve and 30% through sales will look more like a PLG company on this metric.
When high ARR per employee hides problems
A high ARR per employee is not always a sign of health. In some cases, it is a sign of constraint, underinvestment, or deferred maintenance. Here are the four most common scenarios where a high number masks underlying problems.
1. Underinvestment in growth
A company with $800K ARR per employee and a 15% annual growth rate is not efficient — it is stagnant. The high ratio reflects a team that is too small to capture the market opportunity. Competitors with lower ARR per employee but 80% growth rates will pass them within two to three years. The right question is not "how high is our ARR per employee?" but "is our ARR per employee appropriate for our growth ambition?"
2. Burned-out teams and high turnover
When a company achieves a high ARR per employee by running a skeleton crew, the cost shows up elsewhere. Engineering backlogs grow. Support response times slip. Key people leave. The metric looks good on a spreadsheet and bad in practice. Track voluntary turnover alongside ARR per employee. If both are elevated, the ratio is not sustainable.
3. Deferred hiring in critical functions
A company may delay hiring in customer success, security, or compliance to keep the ratio high. This works until it does not. A single security incident, a churn spike, or a compliance failure can erase years of "efficiency" gains. ARR per employee should never be optimized at the expense of functional coverage.
4. Revenue concentration risk
A company with $10M ARR, 12 employees, and one customer representing 40% of revenue has a high ARR per employee and a fragile business. The metric does not capture customer concentration, contract renewals, or expansion potential. Always pair it with net dollar retention and customer concentration data.
When low ARR per employee is OK
Just as a high number can mislead, a low number can be perfectly appropriate. Here are four scenarios where a below-benchmark ARR per employee is the right state for the business.
1. Hiring ahead of revenue
The most common and defensible reason for a low ratio is deliberate hiring ahead of demand. A Series B company that just raised $20M may hire 15 engineers to build a new product line, 10 salespeople to enter a new market, and 5 customer success managers to support anticipated growth. ARR per employee will drop for two to four quarters. If the hires are good and the plan is sound, the ratio will recover as revenue catches up.
2. Heavy R&D investment
A company building a technically complex product — infrastructure software, security tools, AI platforms — may carry a larger engineering team than a typical SaaS company at the same ARR level. The low ARR per employee reflects investment in the product, not operational inefficiency. The bet is that the product will command higher prices or win larger deals once it reaches maturity.
3. Market expansion
Entering a new geography or vertical often requires upfront investment in local sales, marketing, and support before revenue materializes. A company expanding from the US to Europe might add 10 employees and generate only $500K in European ARR in year one. The blended ARR per employee drops. This is a strategic investment, not a failure.
4. Early-stage companies with product-market fit work-in-progress
Pre-seed and seed companies are supposed to have low ARR per employee. They are building the product, finding the first customers, and iterating on the model. A seed-stage company with $200K ARR and 8 employees ($25K per employee) is not broken — it is early. The metric becomes meaningful only after product-market fit is established and the revenue engine is running.
How to improve ARR per employee
Improving ARR per employee means growing revenue faster than headcount. The sustainable levers are product and process improvements, not headcount reductions. Here are the six most effective approaches.
1. Increase average contract value
The fastest way to improve ARR per employee without cutting headcount is to increase the revenue each customer generates. This can mean moving upmarket to serve larger customers, adding premium tiers, or introducing usage-based pricing that grows with customer value. A 30% increase in ACV with the same team size produces a 30% improvement in ARR per employee.
2. Improve sales efficiency
For sales-led companies, the sales team is often the largest functional group. Improving quota attainment, reducing ramp time for new reps, and increasing win rates directly improves ARR per employee. Specific tactics include better lead qualification, sharper sales enablement, and tighter alignment between marketing and sales on ideal customer profile.
3. Reduce churn and increase expansion
Net dollar retention above 110% means your existing customer base grows without adding new logos. This is the most capital-efficient form of revenue growth. Invest in customer success, product stickiness, and expansion revenue streams. Each point of NRR improvement flows directly to ARR — and to ARR per employee if headcount stays flat.
4. Automate manual workflows
Every hour your team spends on manual data entry, report assembly, or repetitive operational tasks is an hour not spent on revenue-generating work. Automate finance reconciliation, CRM data hygiene, reporting, and routine customer communications. The goal is not to eliminate jobs — it is to free people for higher-leverage work.
5. Delay non-critical hires
Not every open role needs to be filled immediately. Before adding headcount, ask whether the work can be automated, outsourced, or absorbed by the existing team. A common mistake is hiring a full-time person for a function that requires 20 hours per week. Consider fractional hires, contractors, or tools before committing to a new FTE.
6. Focus on revenue-per-function, not just company-wide
While ARR per employee is a company-wide metric, the actionable insight often lives at the function level. Calculate ARR per sales rep, ARR per support agent, and revenue per engineer. These function-level ratios reveal where the leverage is and where the bottlenecks are. A company with strong sales efficiency but bloated operations should fix operations, not cut sales.
ARR per employee vs other efficiency metrics
ARR per employee is useful, but it is not sufficient. No single metric captures the full picture of a SaaS company's health. The table below compares ARR per employee to the other metrics operators and investors use most often.
| Metric | Formula | What it measures | When to use it |
|---|---|---|---|
| ARR per employee | ARR / FTEs | Workforce efficiency | Comparing operational leverage across companies or tracking hiring efficiency over time |
| Burn multiple | Net burn / Net new ARR | Capital efficiency | Evaluating how much cash is required to generate each dollar of new ARR |
| Rule of 40 | Growth rate + Profit margin | Growth-profit balance | Assessing whether a company is growing fast enough to justify its burn, or profitable enough to justify slower growth |
| Gross margin | (Revenue - COGS) / Revenue | Product scalability | Understanding how much of each revenue dollar is available to cover operating expenses |
| LTV:CAC ratio | Customer LTV / CAC | Unit economics | Evaluating whether the cost to acquire a customer is justified by the revenue that customer generates |
| CAC payback period | CAC / Monthly gross margin per customer | Cash recovery speed | Measuring how quickly acquisition investment is recovered through customer revenue |
These metrics are complementary, not competitive. A company with high ARR per employee but a burn multiple of 3.0× is efficient on headcount but inefficient on capital. A company with low ARR per employee but a Rule of 40 score of 50 is investing heavily in growth and still delivering a strong combined result. The best operators track all six and understand how they interact.
For a deeper look at how these metrics fit together, see our guide to SaaS unit economics — the metrics investors check first when they open the data room.
How Fairview helps track workforce efficiency
ARR per employee is a useful metric, but it is a lagging indicator. By the time the ratio has declined meaningfully, the over-hiring has already happened. What operators need is a system that surfaces efficiency signals before they become problems — alongside the revenue, margin, and pipeline data that explains why the metric is moving.
Fairview's Operating Dashboard connects to your CRM, finance tools, and payment processor to give you a single view of the metrics that matter. Instead of calculating ARR per employee manually at quarter-end, you see it updated continuously alongside headcount trends, revenue growth, and burn.
The dashboard surfaces workforce efficiency in context. When ARR per employee drops after a hiring wave, Fairview shows you whether the new hires are in sales, engineering, or operations — and whether pipeline coverage, deal velocity, or product delivery metrics are moving in the right direction to justify the investment. You see the number and the story behind it.
Fairview's Forecast Confidence Engine projects whether planned hiring will improve or degrade ARR per employee based on current pipeline and revenue trends. The Next-Best Action Engine flags specific actions when efficiency metrics drift: review quota attainment, audit time-to-productivity for recent hires, or delay non-critical open roles.
The Weekly Operating Report delivers a summary every Monday morning — revenue vs. forecast, margin vs. prior period, pipeline changes, and efficiency indicators including ARR per employee trend. You arrive at your review briefed, not building.
Key takeaways
- ARR per employee measures workforce efficiency by dividing Annual Recurring Revenue by total full-time headcount. It is a proxy for operational leverage, not a standalone health score.
- Benchmarks vary by stage: seed $100K–$250K, Series A $200K–$350K, Series B–C $350K–$500K, public SaaS $500K–$800K. Product-led companies typically run 30–50% higher than sales-led companies at the same stage.
- A high ARR per employee can hide underinvestment, burned-out teams, or deferred hiring. A low ARR per employee can reflect strategic hiring ahead of revenue, heavy R&D investment, or market expansion.
- The most sustainable improvements come from growing revenue faster than headcount — through pricing, sales efficiency, churn reduction, and automation — not from cutting team size alone.
- ARR per employee should always be interpreted alongside burn multiple, Rule of 40, gross margin, and unit economics. No single metric tells the full story.
If you are ready to track ARR per employee alongside your full operating picture — revenue, margin, pipeline, and forecast — book a demo to see how Fairview surfaces workforce efficiency metrics in the context of your weekly operating rhythm. Or explore Fairview to learn how the Operating Dashboard, Forecast Confidence Engine, and Next-Best Action Engine work together to turn data into decisions.
How do you calculate ARR per employee?
Divide your total Annual Recurring Revenue by your current full-time employee count. Use the formula: ARR per employee = Total ARR / Total FTEs. For example, a company with $5M ARR and 20 employees has an ARR per employee of $250K. Use the most recent ARR figure and the current headcount — not the average over the year. Include all full-time employees, including founders, executives, and support staff. Exclude contractors and part-time workers unless they work full-time equivalents.
Why is ARR per employee an important metric?
ARR per employee measures how much recurring revenue each person in the company generates. It is a proxy for workforce efficiency and capital efficiency. Investors use it to compare operational discipline across companies at similar stages. Operators use it to detect over-hiring, underperformance, or structural inefficiency before it shows up in the cash balance. A declining ARR per employee after a hiring wave often signals that new hires have not yet ramped to productivity — or that the company hired ahead of demand.
Can ARR per employee be too high?
Yes. An unusually high ARR per employee can indicate underinvestment in growth, a burned-out team, or deferred hiring in critical functions like engineering and customer success. A company with $800K ARR per employee but a 6-month engineering backlog and a customer success team of one is not efficient — it is constrained. The metric should be interpreted alongside growth rate, employee satisfaction, and functional coverage. High ARR per employee with flat or declining revenue is a warning sign, not a strength.
How does ARR per employee differ by go-to-market motion?
Product-led growth companies typically run higher ARR per employee because they acquire customers through self-serve channels with fewer sales and marketing hires. Sales-led companies run lower because they require larger go-to-market teams — SDRs, AEs, sales engineers, and customer success managers. At Series B, a PLG company might show $500K to $700K per employee, while a sales-led company at the same stage might show $300K to $450K. Neither is inherently better — the metric must be evaluated against the company's chosen motion and the unit economics that motion produces.
What is the difference between ARR per employee and revenue per employee?
ARR per employee uses Annual Recurring Revenue, which is the annualized value of recurring subscription contracts. Revenue per employee typically uses GAAP revenue, which recognizes income as it is earned and may include one-time fees, services revenue, and non-recurring items. For SaaS companies, ARR per employee is the more relevant metric because it reflects the scalable, predictable portion of the business. A company with $10M ARR and $2M in services revenue should calculate ARR per employee using the $10M figure, not the $12M total.
How can a SaaS company improve its ARR per employee?
Companies improve ARR per employee by growing revenue faster than headcount. Specific levers include: increasing prices or moving upmarket to raise ACV; improving sales efficiency so each rep closes more; automating manual workflows in finance, ops, and customer success; reducing churn to protect the revenue base without adding headcount; and delaying non-critical hires until revenue growth justifies them. The most sustainable improvements come from product and process changes that allow the same team to serve more customers or generate more revenue per customer — not from cutting headcount alone.